
Introduction
Researchers have been perplexed by the issue of unit nonresponse since the beginning of practicing survey research. It is common for selected respondents not to participate in an interview for such reasons as failure to establish contact with the respondents, their refusal to participate, or an inability to do so (e.g., because of a language barrier or absence). Researchers have been attentive to the causes that lead to the phenomenon of unit nonresponse. In addition to respondents’ sociodemographic background and psychological predisposition, the sociopolitical environment in which the survey is conducted, as well as the mode, design, and topic of the survey, and the interviewers’ skills and motivation also influence whether respondents participate when contacted (Groves & Couper, 1998, pp. 29–42; Hox & de Leeuw, 2002; Johnson et al., 2002; Kynn, 2008, pp. 37–45).
The impact of unit nonresponse also warrants noting (Dillman et al., 2002, pp. 4–6; Kynn, 2008, pp. 50–54; Lohr, 2010, pp. 330–332). If the occurrence of unit nonresponse is not randomly distributed, certain factors systematically determine whether a selected respondent may successfully participate in a survey. People with particular characteristics are more likely to be nonrespondents. When these characteristics are relevant to the issues studied by the researchers, the presence of unit nonresponse diminishes the representativeness of the final sample, resulting in biased estimation, and researchers cannot draw valid inferences from the sample coefficient to the population parameter of interest.
Various methods and techniques have been introduced to correct for the bias resulting from unit nonresponse. Researchers commonly employ weighting and imputation in an attempt to reduce unit nonresponse bias (Bethlehem, 2002; Gelman & Carlin, 2002; Marker et al., 2002). However, because researchers have little to no information regarding unit nonrespondents, it is unlikely that they are able to examine the differences between participants and nonrespondents to estimate the loss of representativeness in the final sample compared with the target population. Therefore, the lack of information regarding the absentees complicates addressing the unit nonresponse bias in a satisfactory manner.
The knowledge regarding unit nonrespondents must be enhanced to conduct accurate assessments of the potential impact of unit nonresponse (Lohr, 2010, pp. 332–333). The main difficulty regarding the unit nonresponse issue in telephone surveys is that researchers cannot explore the identity of selected nonrespondents, because interviewers typically do not have the opportunity to establish contact with them, or are rejected at the beginning of the interview. In other words, because of the unavailability of information regarding the nonrespondents, bias resulting from unit nonresponse cannot be fully removed, and the representativeness of the incomplete sample cannot be adjusted to a satisfactory level.
It has been repeatedly found that there exists similarity between husbands and wives in terms of their political attitudes and behaviors (Hayes & Bean, 1992; Hayes & Jones, 1992; Lampard, 1997; Plutzer & McBurnett, 1991; Stoker & Jennings, 1995; Zukckerman et al., 2005). One of the reasons why individuals and their spouses have similar political orientations is the close interaction between husbands and wives (Stoker & Jennings, 2005). It is common for individuals to explicitly or casually expose their political views to their spouses on a variety of occasions. The information regarding the nonrespondents provided by their spouses should be reliable and accurate to a substantial extent, although not perfectly valid.
Therefore, the purpose of this study was to examine the demographic characteristics and political attitudes of nonrespondents by relying on information provided by their spouses, which was obtained through a telephone survey conducted in Taiwan. Afterward, we compared the nonrespondents and participants according to their demographic characteristics and political attitudes. If nonrespondents and participants are similar, unit nonresponse does not negatively affect the representativeness of the data collected. If a significant difference between the two groups exists, the issue of representativeness must be examined further and addressed.
It is common that survey practitioners have no access to the personal information of nonrespondents in telephone surveys, the only way for researchers to properly guess who the nonrespondents are is to compare the demographic characteristics of the respondents and the target population. As long as the census data of the target population is available, the comparison between the respondents and the target population is practicable. However, in the case of political attitudes, there is no possibility for researchers to obtain the valid population parameters in order to estimate the bias resulting from nonresponse. Therefore, it is hard for the existing literature to provide this study with possible guidelines to develop hypotheses regarding who are more likely to become nonrespondents in terms of their political attitudes. As a result, this study focused on the political situation in Taiwan to propose possible factors related to the nonrespondents’ political attitudes in order to do a preliminary analysis of nonrespondents.
Taiwan is a unique case among the third wave of democratization. People in this society have been divided in their progress toward democracy. Specifically, Taiwan has been divided into two main political camps, the Pan-blue and the Pan-green. This "blue"and “green” cleavage is composed of three related, but not identical elements in Taiwan: ethnicity, self-identity, and partisanship. According to their place of origin, people in Taiwan are usually classified into four main ethnic groups: Minnan Jen, Hakka Jen, Mainlander, and Aborigine (Wachman, 1994, pp. 15–16). While the Pan-green camp supporters are predominantly composed of Minnan Jen, most Mainlanders support the Pan-blue camp. The related phenomenon is a divided self-identity, which has caused people in Taiwan to be classified into three groups. Some people call themselves Taiwanese, others identify themselves Chinese, and still others say that they are both Taiwanese and Chinese. While most of the Pan-green supporters identify themselves as Taiwanese, those who call themselves Chinese tend to support the Pan-blue camp. Both ethnic group membership and self-identity have critical impacts on people’s political attitudes and behaviors (e.g., Liu, 1996, 1999; Wu, 1995, Chapter 4). The last important factor of Taiwan’s political cleavage is partisanship. The Democratic Progress Party (DPP) and the Nationalist Party, also known as the Kuomintang (KMT), play the leading roles in the Pan-green camp and the Pan-blue camp, respectively. This study thus focused on the related factors to examine the possible differences of political orientations between respondents and nonrespondents.
Data
In this study, we analyzed a telephone survey data set to explore the characteristics of unit nonrespondents. This telephone survey was conducted in June 2011 by the Election Study Center at National Chengchi University, Taiwan. The survey was originally designed for data collection to examine the similarities (dissimilarities) of husbands and wives regarding their attitudes toward political and social issues in Taiwan. The questions asked in this survey pertained to each participant’s demographic background, interactions with their spouses, political and social attitudes, and the political attitudes of their spouse as perceived by them.
The survey population was comprised of married couples in Taiwan, and a nationally representative list of landline phone numbers was adopted to contact the respondents. Prior to the interview, the number of couples living in each household was ascertained before randomly selecting one of the couples, if there were more than one, as the selected respondents. The selected husbands and wives were invited to participate, and 354 couples were successfully interviewed in this survey. In addition to these couples, 804 married adults were interviewed, but their spouses failed to participate because of their inability, refusal, or unavailability. These absentees were the unit nonrespondents.
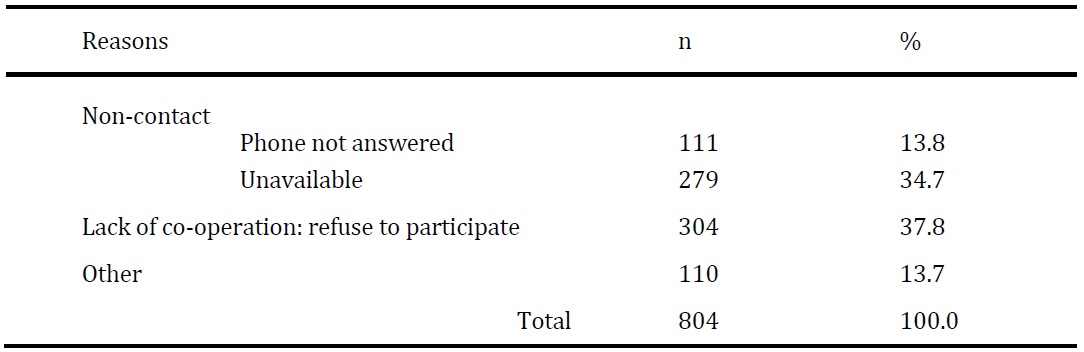
Table 1 shows the reasons for the nonresponse of the 804 people whose spouses participated in the telephone interview. Although nearly half of them did not participate because the interviewers could not establish contact, 37.8% of them immediately refused to participate when contacted, or refused to continue during the interview. The remaining 13.7% of nonresponses occurred because of other potential reasons or technical problems (e.g., the language barrier, physical inability, or the contact number was for a fax or answering machine).
In addition to demographic variables such as gender, ethnicity, income, and occupation, we questioned their spouses regarding the nonrespondents’ political attitudes such as party preference and political support. We were thus able to examine the nonrespondents’ political attitudes based on information provided by their spouses.

The respondents were divided into the following two groups, based on whether both spouses were interviewed: (a) pairs of husbands and wives (n = 354); and (b) married individuals (n = 804). The next section of this article introduces the two data sets, which we analyzed and compared to assess the demographic characteristics and political attitudes of the nonrespondents. The analytical results may be helpful for researchers estimating the effects of unit nonresponse on the representativeness of the final sample regarding their political attitudes.
Analytical Strategy
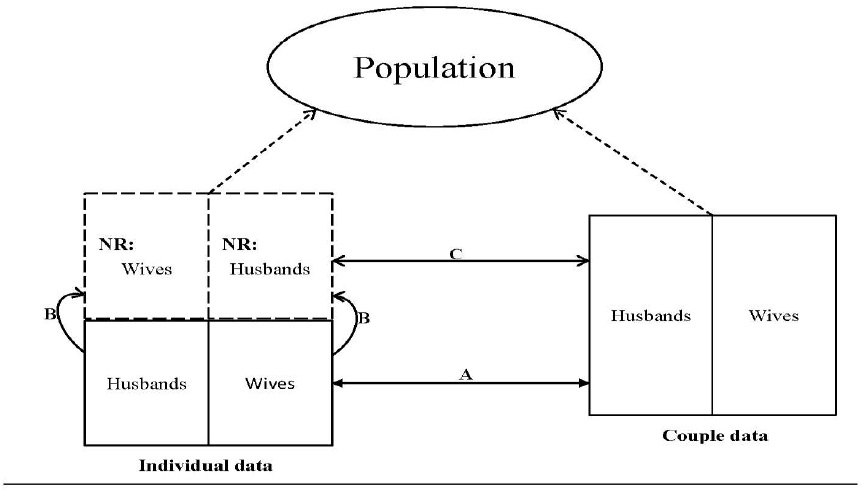
Because information on the 804 nonrespondents was provided by their spouses who participated in the survey, we developed the following analytical strategy (Figure 1) to examine the nonrespondent characteristics. The analytical strategy was based on the notion that the two sample data sets under examination are equivalent and representative of the target population if unit nonresponse is absent in both data sets. This analytical strategy is composed of three steps of comparison.

In the first step, we compared the demographic variables of the 354 pairs of husbands and wives (hereafter referred to as “couple data”) against those of the 804 individual wives or husbands (hereafter referred to as “individual data”). If the occurrence of unit nonresponse in the individual data is randomly distributed, this should indicate that the participants and nonrespondents are similar, and therefore, no significant difference exists between the individual data and the couple data (relationship A in Figure 1). Second, we examined the demographic background and political attitudes of the nonresponse spouses in the individual data set in accordance with the information provided by their spouse participants (relationship B). Finally, we compared the nonrespondents in the individual data set to the respondents in the couple data to determine whether the unit nonrespondents differed from the respondents between the two data sets, and to further assess the potential concern of biased estimation resulting from unit nonresponse (relationship C).
Data Analysis
By completing these three steps of analysis, we compared the respondents in the two data sets. If both samples were originally equivalent when they were randomly selected, and if unit nonresponse occurred randomly during the interview, the respondents of the two data sets should have somewhat similar characteristics. As shown in Table 2A, sex was a critical factor contributing to the occurrence of unit nonresponse. Despite the even number of men and women in the couple data, the ratio of men to women in the individual data was approximately 4:6. Compared with the female participants, the men were significantly more likely to be unit nonrespondents.
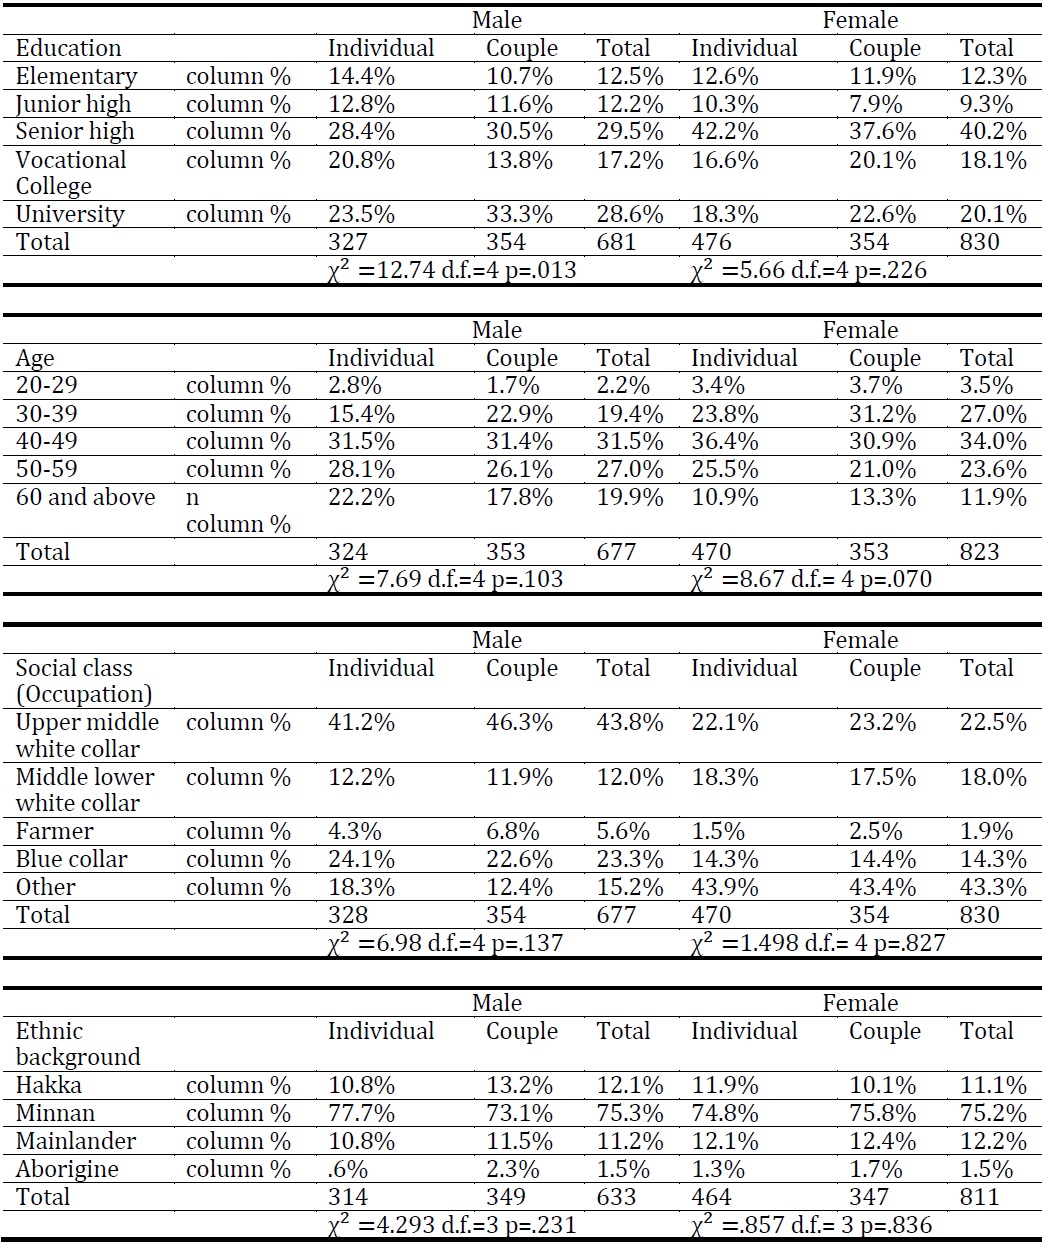
Because the original unit of observation in this survey was couples, not individual respondents, we controlled for the sex variable in the remainder of the analysis to meet the purpose of the present analysis, the unit of which was individual (non)respondents. We compared the demographic background of all respondents from the two data sets. The results are listed in Table 2B.

Overall, no substantial gap was present between the two respondent groups regarding their demographic characteristics. Only one difference reached the .05 level of significance. The level of education differed significantly between the men in the couple data set and their counterparts in the individual data set. Male respondents in the couple data were more likely to have a higher level of education than those in the individual data. This difference in education between men in the two groups revealed that men with a higher level of education are more likely to be unit nonrespondents. A similar pattern emerged for the female respondents, although the difference was not statistically significant. Well-educated people may be more likely to be employed as well as engage in social activities in the evening when public opinion polls are conducted, and thus, they are more likely to be absent from interviews.
In addition, age seemed to be a factor influencing whether selected respondents would participate in the survey, although the difference was nonsignificant. The same pattern for age was found for men and women: More people were in their thirties in the couple data than in the individual data. This difference indicates that people in this age group are more likely to be unit nonrespondents. Because people in their thirties are more likely to be occupied with various tasks and familial responsibilities, it is logical that such people were less likely to be interviewed successfully in the telephone survey. In addition, given that the survey targeted married adults in Taiwan and that the average age for a first marriage was about thirty, only a small number of participants were in their twenties in both individual and couple data sets.
Although respondents of both the individual data set and of the couple data set appeared to have similar ethnic backgrounds and to be in the same social class, the education level and gender of the two respondent groups differed significantly. Men, particularly those with the highest education levels, were more likely to be unit nonrespondents. Furthermore, although the results revealed that the age cohort was nonsignificant at the .05 level; younger people were also more likely to be nonrespondents.
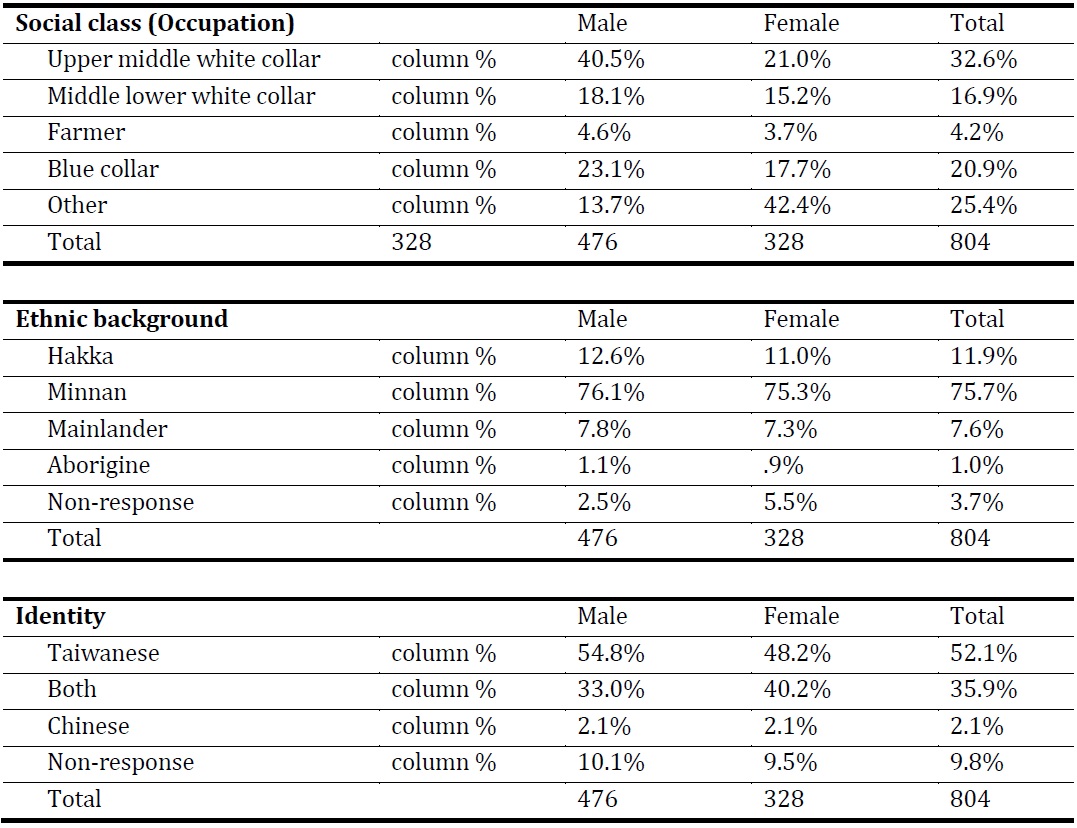
The next step of analysis focused on the information provided by the respondents in the individual data set to investigate the identity of the unit nonrespondents (relationship B in Figure B). The interviewers asked each respondent for information about his or her spouse’s occupation, ethnic background, Taiwanese or Chinese identity, partisanship, and the evaluation of the two major presidential candidates in 2012 (i.e., Ma, candidate of the KMT and Tsai, candidate of the DPP). Table 3 lists the male and female nonrespondents’ background information and attitudes as reported by their spouses.


Regarding social class, recoded based on their occupation, more than 40% of male nonrespondents were members of the upper middle class, and nearly 25% were blue-collar workers. This is logical because work is a crucial factor hindering selected male respondents from participating in a survey. However, this reasoning did not apply to female nonrespondents, a substantial proportion of whom were housewives, and thus, most of them are listed in the last category, labeled as “other.” By contrast, the ethnic background of the nonrespondents (Table 3) reflects the general distribution of ethnic groups in Taiwan. Moreover, there were fewer mainlanders than in typical observations for survey reports. It is possible that mainlanders are more likely to be nonrespondents. Regarding partisanship, most of the male nonrespondents supported the pan-blue camp, whereas female nonrespondents were equally distributed among the main partisan groups. Concerning their evaluation of Ma and Tsai, the two major presidential candidates of 2012, the proportion of nonrespondents who held positive and negative attitudes toward the two major political figures was similar.
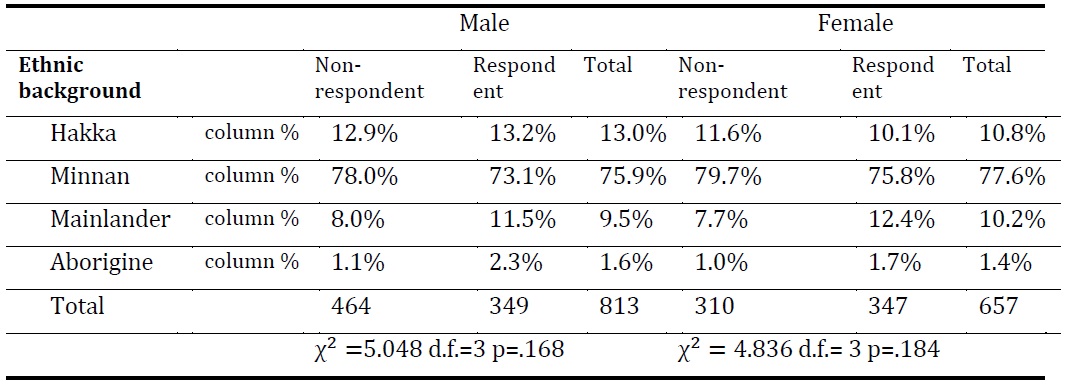
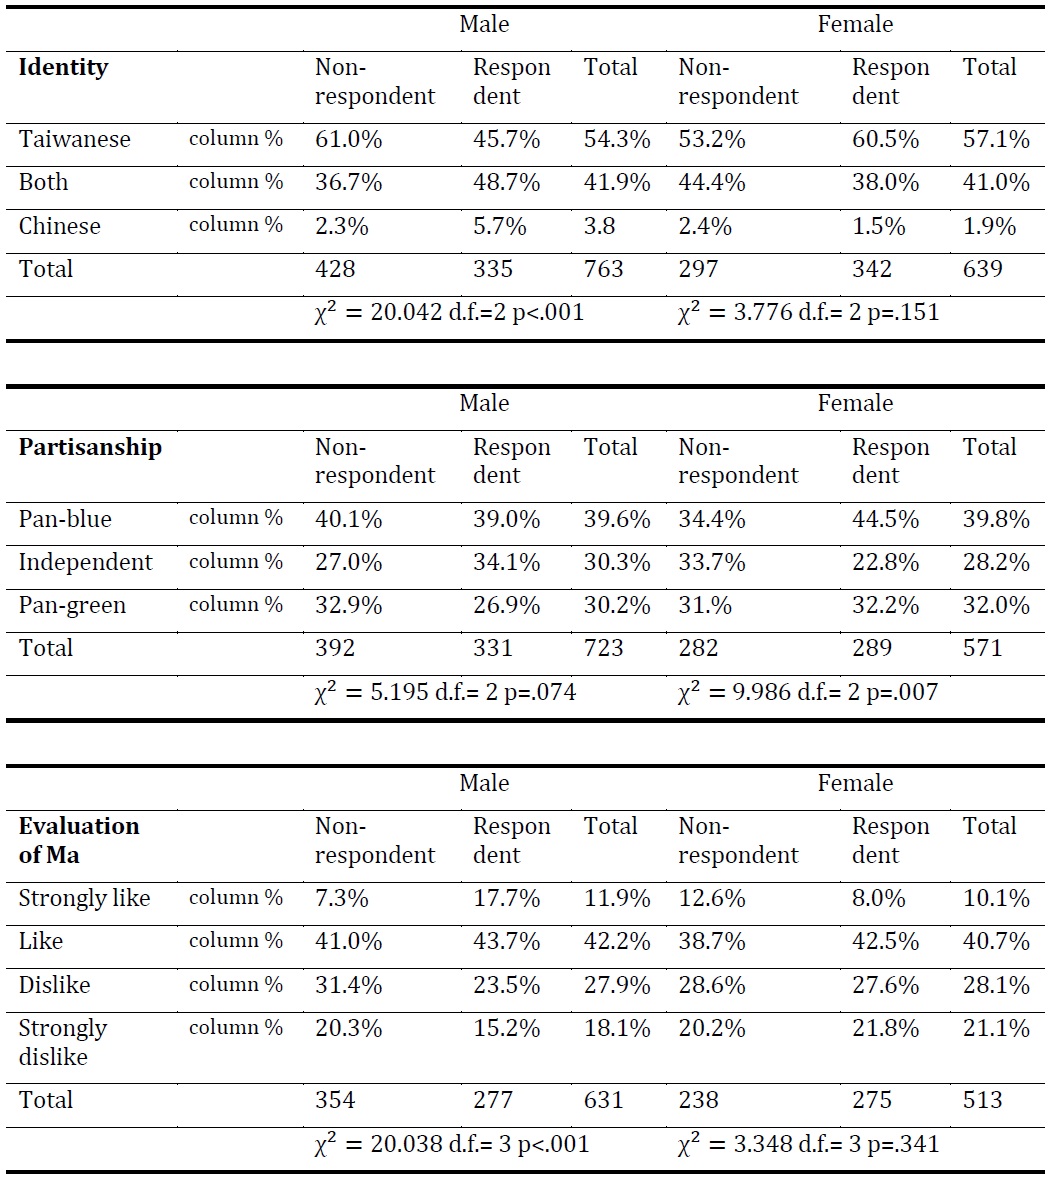
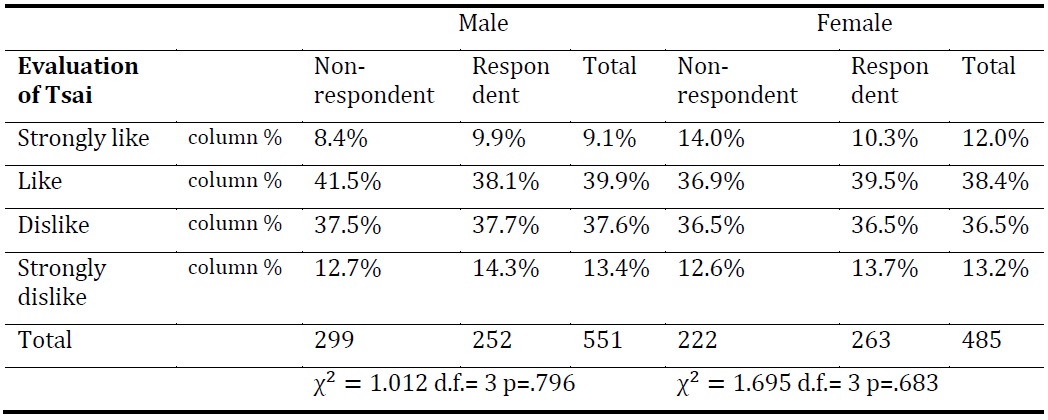
This distribution of nonrespondents’ attitudes must be compared against that of participants to assess whether the two groups exhibited political differences. The following is a comparative analysis between the unit nonrespondents in the individual data and the respondents in the couple data (relationship C in Figure 1). We focused on factors related to political cleavage in Taiwan, which included ethnicity, partisanship, and Taiwanese or Chinese identity. In addition, we also compared their evaluation of Ma and Tsai. The results are listed in Table 4.


Table 4 shows that the Taiwanese or Chinese identity, partisanship, and evaluation of Ma differed significantly between respondents and nonrespondents. Although 61% of male nonrespondents were reported by their wives as Taiwanese, only 45.7% of male respondents expressed their identity as such. Therefore, the presence of unit nonresponse led to an underestimation of Taiwanese identification and an overestimation of dual identification among male respondents. A similar pattern emerged regarding the male nonrespondents’ partisanship, which is related to the issue of identity: they were more likely to be pan-green supporters, although the difference was nonsignificant. Relevant to the issue of identity and partisanship, the majority of male nonrespondents disliked Ma, who belongs to the pan-blue camp and is viewed as a pro-China politician.
However, female nonrespondents and respondents were more politically similar than their male counterparts, with the sole exception of partisanship. Differing from the male nonrespondents, female nonrespondents were more like to be independents, and less likely to be pan-blue supporters. In brief, the male nonrespondents were clearly politically different from the male respondents, and this may have led to a biased estimation of the population parameter. However, the different patterns observed between these men and women also warrants noting. For instance, the opposite pattern regarding partisanship indicated that the difference between the respondents and nonrespondents among men and women may cancel each other out or reduce the difference, when the sample is taken into consideration as a whole. In other words, varied results may be produced depending on whether univariate or multivariate analysis is conducted.
Conclusion and Discussion
In summary, our analytical findings revealed that demographic characteristics such as sex, education, and age are related to the phenomenon of unit nonresponse. Men and young adults are generally more likely to be nonrespondents in telephone surveys. We also found that men with a higher education level are also more likely to be nonrespondents. The three demographic factors that led to the presence of unit nonresponse reflect that men, young people, and people with a higher education level are typically busy with their careers, and thus, they are less likely to be available or less willing to participate in a survey. These findings are consistent with those of previous studies. For example, (Brehm, 1993, pp. 26–32) also indicated that the proportions of men, younger people, and people with a college degree are often underestimated according to the results of survey data.
We also examined the political attitudes of unit nonrespondents, and found that political attitudes related to political cleavage in Taiwan are associated with unit nonresponse among men (i.e., men who identify as Taiwanese support the pan-green camp, and those who dislike Ma are more likely to be nonrespondents).
In brief, demographic variables as well as political attitudes are related to the likelihood of an individual becoming a unit nonrespondent in telephone surveys. It is common for researchers to conduct weighting to adjust samples and to obtain an equal distribution of the demographic variables for the collected sample and population. Our analytical results revealed that demographic characteristics are related to unit nonresponse. Therefore, using demographic variables to compute the weight of each case for enhanced generalizability is a reasonable solution to obtain a sample that is more representative of the population. However, because political attitudes are also related to the phenomenon of unit nonresponse, weighting cannot be a fully satisfactory solution. Our findings showed an unequal likelihood of being a unit nonrespondent between men on opposing sides of the political cleavage. This bias cannot be appropriately addressed using information on demographic variables. We recommend using households, instead of individuals, as the unit of observation in telephone interviews, so that additional information regarding nonrespondents can be retrieved to estimate and correct for the potential bias resulting from unit nonresponse.
Biographical Note
Kuang-hui Chen is an associate professor of political science at National Chung Cheng University, Taiwan. His fields of research are political socialization, research design, and public opinion. He can be reached at Department of Political Science, National Chung Cheng University, No.168, Sec. 1, University Rd., Min-Hsiung Township, Chia-yi County 621, Taiwan or by email at polkhc@ccu.edu.tw.
Correspondence
All correspondence concerning this article should be addressed to Kuang-hui Chen at the Department of Political Science, National Chung Cheng University, No.168, Sec. 1, University Rd., Min-Hsiung Township, Chia-yi County 621, Taiwan or by email at polkhc@ccu.edu.tw.