


Is Random Always Better? An Analysis Based on the Sampling Methods of Three Surveys in South Korea
Random sampling is generally accepted as the most scientific sampling method. The academic community may not accept surveys using other sampling methods, such as quota sampling, as scientific. Some publications or reviewers may even reject papers based on their sampling method.
While random sampling is the gold standard, it is extremely difficult to implement it fully and perfectly. Some segments of the population are extremely difficult to reach. Repeatedly trying to reach a randomly selected person who does not respond increases survey costs. If refusal rates are too high, the survey may become biased, because difficult to reach segments of the population may be overlooked. In addition, sometimes interviewers make mistakes and do not perfectly implement procedures.
Knowing about these potential problems, we decided to analyze three major surveys that have been conducted at regular intervals in Korea for a number of years. The three organizations conducting these different surveys use different sampling methods. By analyzing demographic variables from each of these surveys and comparing them to the 2010 census data, we can begin to assess whether or not random sampling really produces the least biased sample in the case of South Korea.
Problems with Random Sampling in Korea
It is difficult to access large portions of the Korean population for various reasons. To interview someone in a face-to-face survey, it is necessary to be able to meet that person. While address-based random sampling is possible, it is often difficult to actually access the address. In Korea, 58% of housing units are located in apartment buildings (Statistics Korea (KOSTAT), 2010). Often these buildings have security systems in place that make it extremely difficult to knock on someone’s door.
As of 2015, 45% of Korean households did not have a landline phone (Korea Internet and Security Agency (KISA), 2015), but Korea has no directory of mobile telephone numbers. We do know the mobile phone exchanges and so can generate random digits to dial and discard the numbers that are not in use. It can be time-consuming and costly, but it makes telephone surveys viable.
However, even assuming we can reach people at home or on their phones, Korea has an unusually high refusal rate. The Republic of Korea National Election Commission (NEC) requires that the metadata for all political polls be recorded in their system. Of 1,744 surveys conducted for the 2016 election, 662 had a cooperation rate of 1-5% (38% of surveys), and 446 (25.6%) had a cooperation rate of 5-10%. Only 622 (35.7%) had a cooperation rate of greater than 10%. Telephone surveys with a live interviewer (as opposed to ARS) had a response rate of 14.6% as of March 21, 2016 (Republic of Korea National Election Commission (NEC), 2016). By way of comparison, an analysis of 490 papers in 17 refereed academic journals from multiple countries found that the average response rate of surveys interviewing individuals was 52.7% (Baruch & Holtom, 2008). Of course, there are exceptions; some surveys in Korea have had high cooperation rates. In 2014, the Korean General Social Survey (KGSS) successfully interviewed 1464 of 2500 potential respondents, for a response rate of 58.6% (Social Research Center, SungKyunKwan University (SRC), 2014). The 2006 SSM survey conducted by Gallup Korea had a response rate of 40.2% after 6 attempts to contact respondents. It is also worth noting that certain categories of people may be more likely to answer surveys. For example, housewives may be easier to reach at home than people who work late every night.
Literature Review
Brick (2011) suggests that quota sampling may have gone out of style in the USA primarily because of some high-profile failures in election polls. However, he notes that quota sampling is still used in many other countries. He also discusses the idea that a probability sample with a very low response rate is almost a volunteer sample. However, he believes that, while nonresponse bias does exist, research suggests that it is usually not a serious problem and that coverage error is the more serious problem.
There have been some other attempts to compare quota and random sampling in other countries, showing that the scientific community may consider alternatives to random sampling if it can consistently produce the same results. One such experiment took place in France in 2010. The number of smokers as identified in the annual Health Barometer, which uses a random sample, was compared to a similar survey that used a quota sample. There were some differences in the results, which the authors attributed to the fact that some hard to reach people were more likely to be included in a random sample. The authors concluded that the random sample was more accurate (Guignard et al., 2013).
However, it should be noted that the results in France are not necessarily the same as would be found in Korea. For example, if a randomly selected person comes home late one night, but usually comes home early, trying to contact him multiple times could indeed result in a response, but if someone comes home late every night, as is the case for many in the Korean workforce, it would be impossible to meet him even if interviewers attempt to contact him several times. Multiple contact attempts do make a positive difference, but only to a certain point. In the 2014 KGSS mentioned above, the first 6 attempts to make contact resulted in successful interviews with 85% of the eventual respondents. Contact attempts 7-18 resulted in only an additional 15% of the final respondents. The rest of the sample remained difficult to reach (Social Research Center, SungKyunKwan University (SRC), 2014).
Some results from the USA are also promising for the accuracy of quota sampling. The DDB Needham Life Style survey (now the DDB Life Style survey) is an annual survey that has been conducted by an advertising agency in the USA since 1975. It uses quotas for gender, age, and race. DDB uses MarketFacts to conduct the survey. MarketFacts maintains a panel of respondents from which they randomly invite some members to respond. Data can be weighted if necessary, but is not usually (D. K. Delahorne, personal communication, October 26, 2015). Putnam (2001) compared some of the results of the Life Style survey to the General Social Survey (GSS), which uses a random sample and is a well-respected survey in academic circles. Putnam compared the results from 1975-1999 and found that the results were mostly similar. There were a few differences between the two surveys that made a perfect comparison impossible, but overall the results show that quota sampling can produce useful survey results.
Methodology
Surveys Included
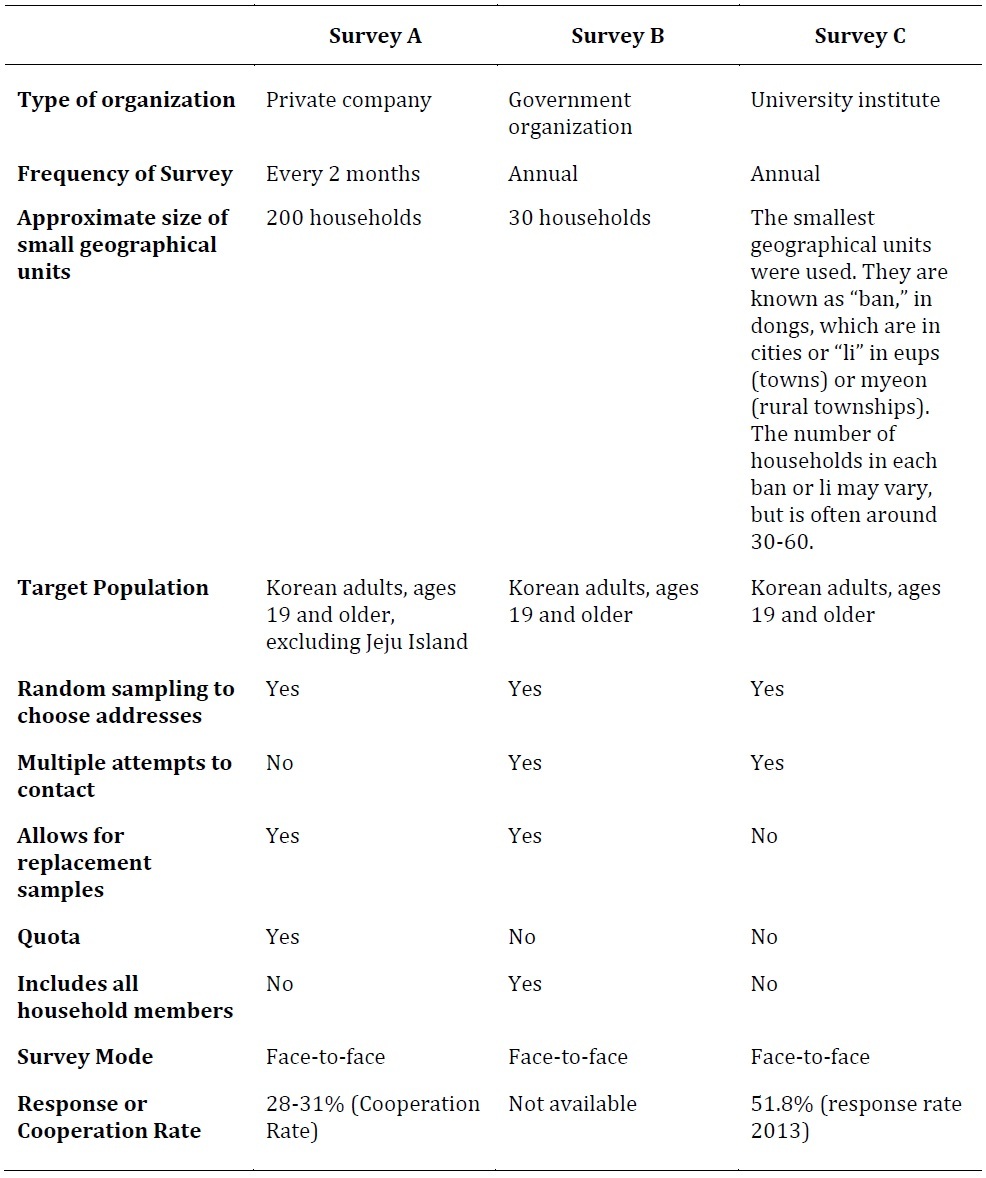
The three surveys discussed here are the Gallup Korea Omnibus Survey (Survey A); the annual Social Survey (Survey B); and the Korean General Social Survey (KGSS or Survey C). The three surveys will be referred to as Survey A, B, and C to make it easier to read. The raw data from Survey B and Survey C are publicly available on their websites (KOSTAT, 2016; Social Research Center, SungKyunKwan University (SRC), 2014). The Gallup Korea data is not publicly available, because Gallup Korea is a private company, but was available to the authors of this paper for the purpose of conducting this analysis, because one of the authors is an employee of Gallup Korea. Some information about the omnibus survey is available on Gallup Korea’s website (Gallup Korea, 2016).
All three survey organizations have divided South Korea into smaller geographic units before sampling. Small geographic units are then sampled from each region of Korea. Addresses are then selected from each sampled neighborhood. This is based on the assumption that people in one small geographic unit will share similar socio-economic characteristics and that stratified sampling, based on these units, will result in the most inclusive survey possible. All of these surveys use face-to-face interviews. The consistency of survey mode increases the validity of the comparison between them.
Survey A. Gallup Korea is a well-known and respected commercial polling company in Korea. It conducts an omnibus survey every two months, which includes questions about a variety of social topics. It should be noted that since this is not an annual survey, we combined the results for the whole year.
Sampling method. Survey A is a nationwide survey of adults ages 19 and older, but does not include residents of Jeju Island. Gallup Korea’s geographic units each contain approximately 200 households. Interviewers canvass selected neighborhoods to collect addresses. Sampling replacement within the same neighborhood is allowed if a respondent is not available at the first visit or refuses to participate. The replacement respondent is chosen according to a pre-determined system. However, a quota system is in place. So, once a quota is filled, no more respondents will be invited to respond from that quota, even if they live at one of the pre-selected addresses. More households will be selected until the quota is filled.
Survey B. Survey B is conducted by Statistics Korea (KOSTAT), the government organization responsible for collecting official statistics in Korea, including the census. They have a few advantages. First, they have the advantage of a complete address list, which other organizations and companies do not have. This address list, which was compiled based on census data, is the basis of their sampling. As employees of a government organization, KOSTAT’s interviewers are generally more trusted and can more easily access apartment buildings than other organizations’ interviewers. They are also funded well enough to make multiple contact attempts possible; this kind of methodology can be cost prohibitive for many companies or scholarly researchers.
Sampling method. They have divided Korea into even smaller geographical units than Survey A. Survey B’s geographical units are as small as 30 households. Households are randomly selected from those units. Interviewers are instructed to go back multiple times to the same address if no one is at home. However, if someone refuses to participate in the survey or cannot be reached after multiple attempts, Survey B allows for sample replacement. To minimize the chance that interviewers will replace a potential respondent without attempting to reach them multiple times, an interviewer must contact his supervisor to get a replacement address. The replacement is randomly selected from the remaining addresses in the geographical unit.
Survey B is different from the other surveys examined here in that all adult members of a household are interviewed. This eliminates the problem of randomly selecting a member of the household. It also serves to increase interviewers’ ability to contact the potential respondents. If an interviewer can contact one member of the household and persuade him/her to participate, that household member can then persuade family members to join as well. This may be more effective than trying to reach a particular member of the household.
Survey C. Survey C is an annual, nationwide survey conducted by the Survey Research Center at Sungkyunkwan University (SKKU). Survey C also uses a form of cluster sampling. However, since they do not have a complete list of addresses, they have another step in their process. There are offices for small, administrative areas, called dongs. Before conducting Survey C, interviewers go to the office for an area and get an up-to-date map showing every ban (the sub-units of a dong, which can change) in that dong. Then the interviewer goes to each ban and counts and makes note of all the housing units in that ban before they can be selected using simple random sampling within each ban. This smallest unit is known as a li in eups (towns) or myeon (rural townships), but the process of counting housing units after obtaining the information about the current boundaries of the li is the same.
Sampling method. Interviewers are university students who are trained by professors who act as their supervisors. A sample point is chosen randomly. If a respondent cannot be reached, there are no replacements. Survey C is proud of its dedication to true random sampling.
Error
The sampling error is not available for Surveys B or C. Sampling error is not measurable for Survey A because it uses quota sampling. Survey C should be the only one of these surveys to have a measurable sampling error, because it is the only one that does not allow for a replacement of the sample.
Of course, there are many other kinds of error (e.g., nonresponse, coverage, measurement) that are worth being aware of, but are difficult to know about or measure. Error is not just theoretical; it also appears in practice. It is the actual, observable differences that we have looked at for this analysis.
Data Comparison
Since most of the survey items were not the same across all three surveys, the fairest comparison is one of demographic variables that were collected for all three surveys. Looking at demographic variables is also useful because we know the true demographic variables of the target population through the census, which is conducted every five years in Korea.
The demographic variables from these three surveys were all compared to the census data to see which survey most closely reflected the actual population of Korea. In addition, since these surveys have all been conducted for multiple years, we considered the stability of the population of each survey. If the sampling methodology of a survey is sound, we would not expect large variations in the demographics of respondents between years.
Results
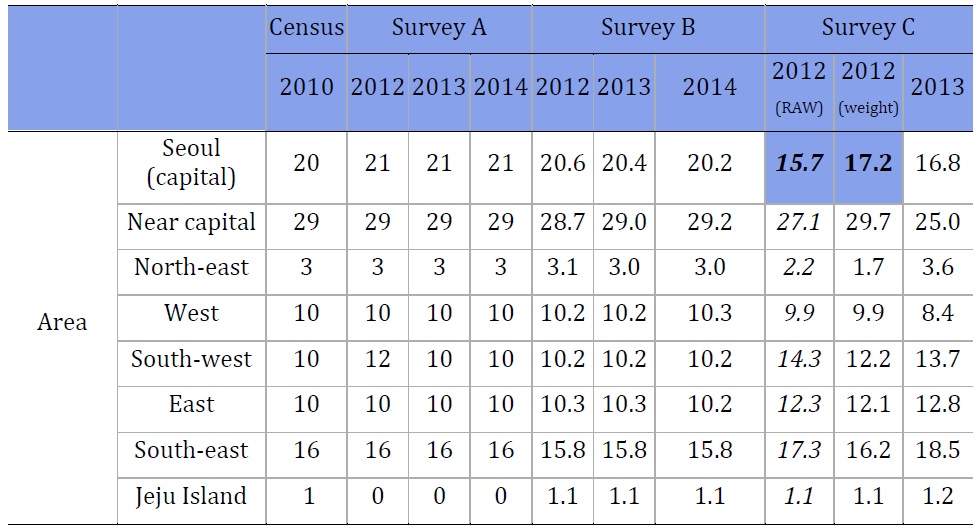
The geographic distribution of respondents was considered. In a representative survey, we might expect that the geographical units chosen would be reflective of the population. We would expect most regions and cities to be covered. In addition, we would expect the demographic variables of respondents, including age and sex, to match the demographics of the population as a whole.
Surveys A and B matched the census data in terms of distribution of respondents by geographical area better than Survey C.
.jpg)
Survey C Response Rates
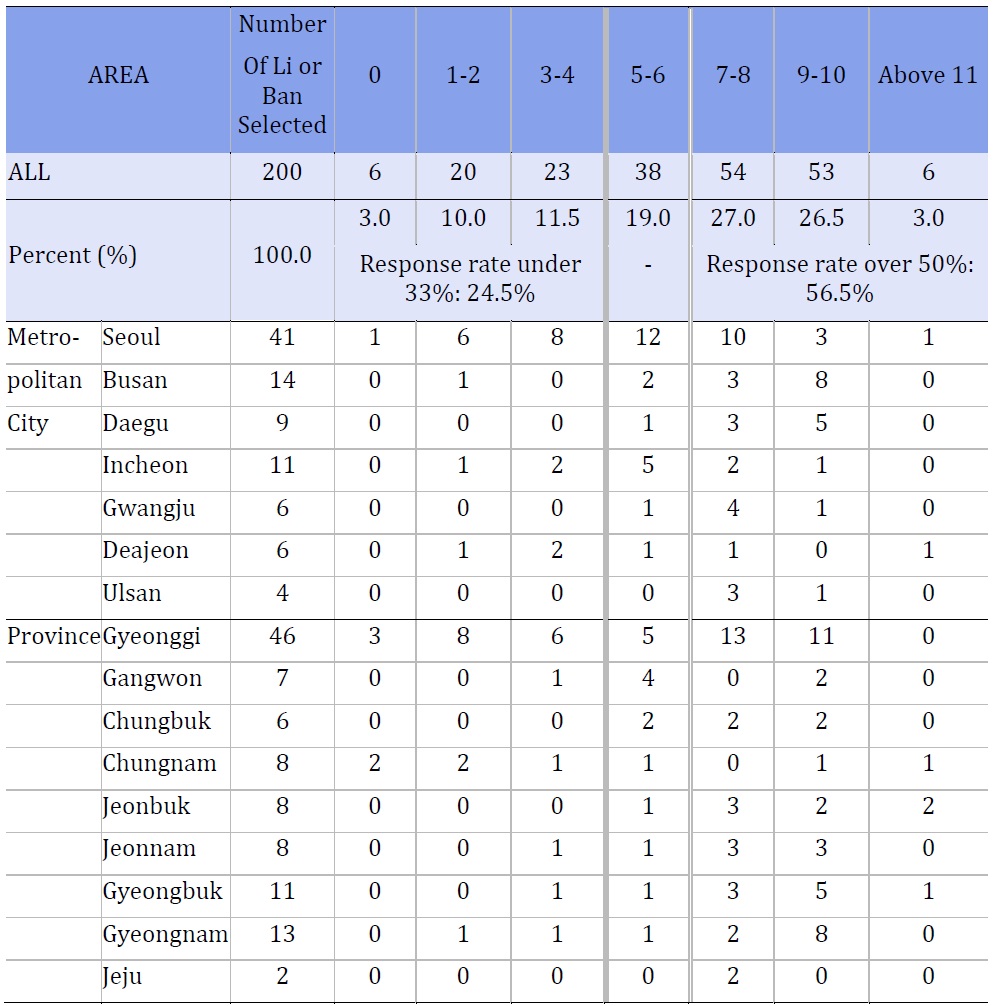
Survey C was the only survey included in our analysis that used true, simple random sampling, i.e., only Survey C did not allow for any respondents to be replaced. As mentioned above, they randomly selected 200 small geographic units. In each unit, 12-13 people were randomly selected. Despite multiple attempts to contact these chosen respondents, in 2013, 24.5% of the selected areas had a response rate of under 33%. The response rate was over 50% in 56.5% of the selected areas.
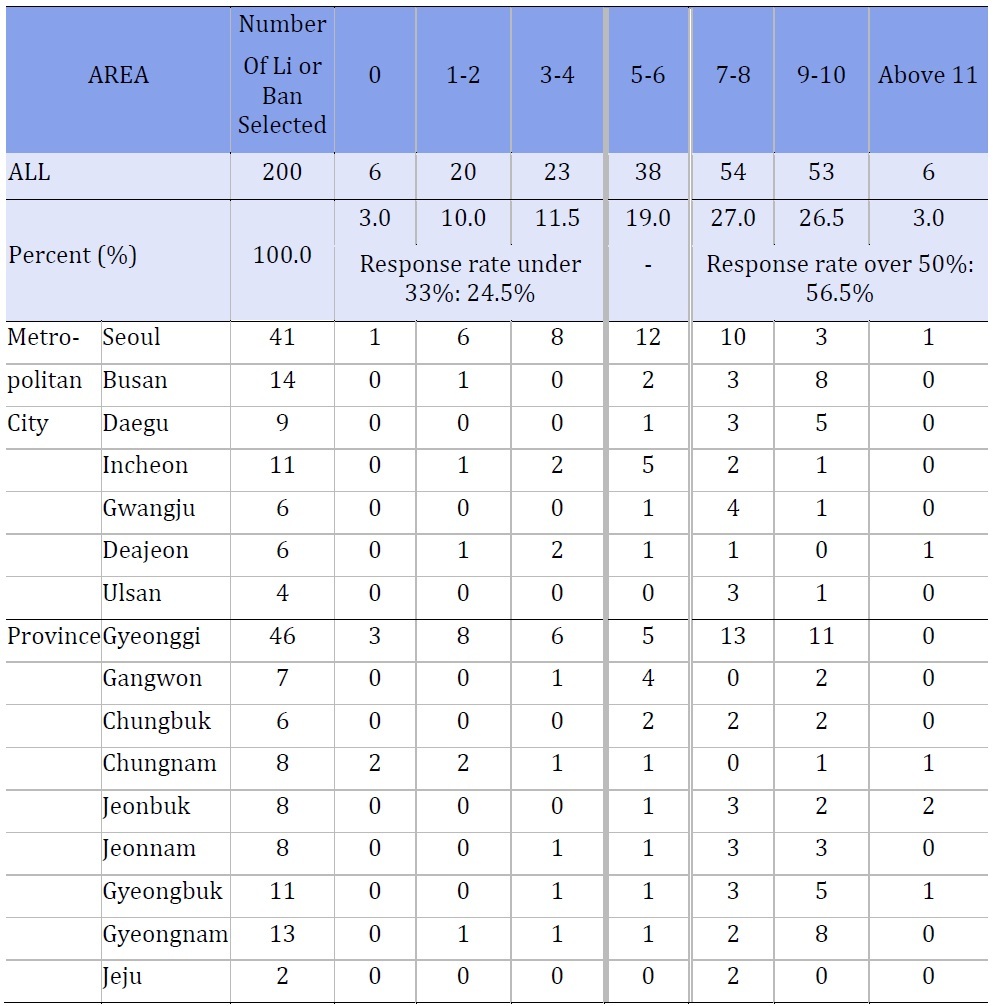
Table 3 shows the number of respondents who answered in each selected li or ban. Within each metropolitan area or province, several li or ban was selected randomly and 12-13 addresses were randomly selected from each of these li or ban. Table 3 shows the number of respondents who completed the survey in each li or ban. For example, 41 bans were selected in Seoul. In 1 of those ban, none of the randomly selected households participated. In another ban, more than 11 chose to participate. Twelve ban in Seoul had 5-6 participants, which means about 29.3% of ban selected in Seoul had a response rate of approximately 50%.
Over- and Under-Sampling in Survey C
Under-representation of certain neighborhoods in Seoul. The city of Seoul is made up of 25 administrative areas (Gu). Despite selecting 41 geographic units in Seoul in 2013, 10 of the 25 Gu were not included. Of those 10 that were not represented in the survey, 7 had a population of more than 200,000 people.
Over-representation of certain cities. Certain cities were over-represented in Survey C in 2013. Normally, we would expect that when geographic areas are randomly selected, city areas and rural areas would be represented proportionately according to their population. However, this was not always the case. The cases below highlight some of the surprising sampling results in 2013.
Gyeongbuk province. Eleven geographic units were selected from Gyeongbuk province. However, these units tended to focus on a few cities. Gumi City has a population of 330,384 people, or 14.6% of the province’s population, but 5 of the 11 selected geographic units were located in that city, or approximately 45%. Another 2 of the areas, or approximately 18% of the sample from Gyeongbuk province, came from Kimchun City, which has 5.2% of the area’s population. In other words, approximately 64% of the sample from Gyeongbuk lived in cities that made up just 19.8% of the province’s population.
Gyeongnam province. Kimhae is a city in the province of Geyongnam that, with 413,622 people, makes 15.0% of the population of the province. However, 5 of the 13 geographic units from that province, or approximately 38%, were from Kimhae.
Jeonnam province. A similar situation also happened in Jeonnam, where 3 of the 8 selected areas from the province, or approximately 38%, came from the city of Sooncheon, where 14.1% of the province’s population lives.
Rural areas under-sampling. Rural areas in Korea are known as myeon. According to the 2010 census, 18% of South Koreans live in myeon. In 2012, 38 of the total 200 sampled geographic units were in myeon; at 19% of the sample units, this number seems appropriate. However, in 2013, only 2 of the 200 geographic units, or 1%, were in myeon. Furthermore, in 2 provinces, only a few cities were represented. In the province of Chungbuk, only the cities of Choengju and Chungju, representing 65.0% of the province’s population, were included in the survey. In Gyeongnam, three cities, Changwon, Kimhae, and Yangsan, which contain 56.0% of the province’s population, were included in the survey. Normally, we would expect greater stability in the number of rural areas included and that they be more reflective of the population as a whole.
Demographic Comparisons Between the Surveys
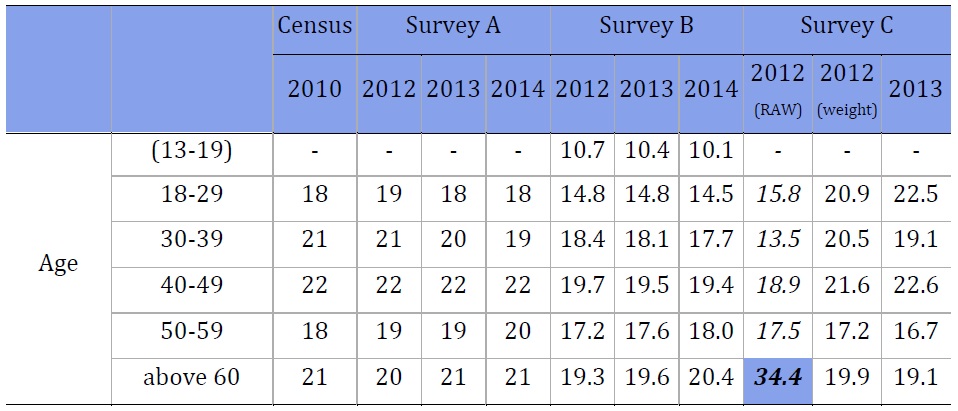
Age. Survey C was found to be the least stable of the surveys we analyzed in terms of age demographics. In most years, Survey C does not weight its results. However, in 2012, Survey C’s demographic variables, especially related to age, were too different from the demographic characteristics of the country. When compared to the official resident demographic data, the three surveys were close, but not perfect. However, Survey C was often the most off. The unweighted results from 2012 highlight these problems. While 22.4% of the population is over 60 years old, in Survey C in 2012 (unweighted data), 34.4% of the respondents were in that age group.
.jpg)
Gender. All surveys were similarly representative in terms of gender.
.jpg)
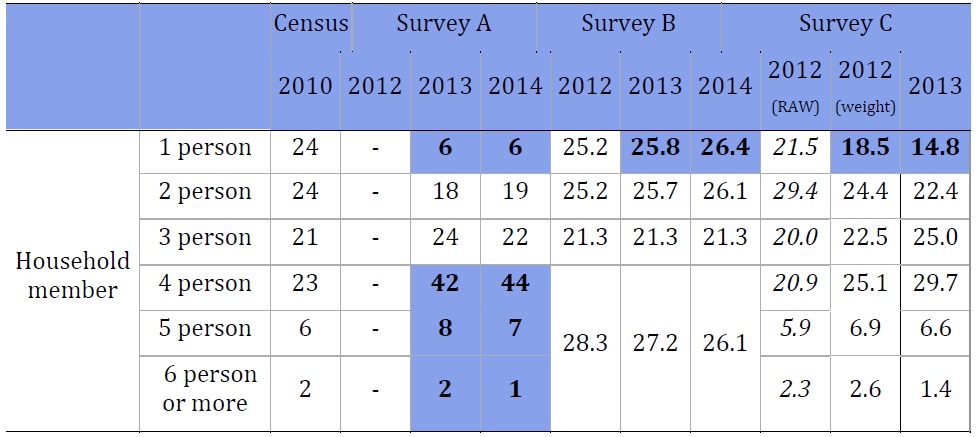
Household size. Survey A’s demographic results were, as expected, very close to the census results in the categories considered by the quota: age, sex, and geographic area. However, one-person households are more likely to be under-represented in Survey A. As mentioned earlier, 24% of Korean households are one-person households. However, only 6% of Survey A’s respondents live in one-person households. One-person households were also under-represented in Survey C, but not as dramatically: 14.8% of Survey C’s respondents were from one-person households, which is still nearly 10 percentage points off the actual population. Survey B was closest to matching the census results, with 25.8% of respondents coming from one-person households (2013). Conversely, Survey A over-represented four-person households. The census shows that 23% of Koreans live in four-person households. In 2013, 44% of Survey A’s respondents came from four-person households.
.jpg)
Marital status. A related variable is the marital status of respondents. Those living in one-person households are less likely to be married. So, it is not surprising that married couples were over-represented in Survey A (73% in 2014 compared to the 63% in the census). Conversely, divorced or widowed respondents were under-represented in Survey A (4% in 2014 compared to 13% in the census).
.jpg)
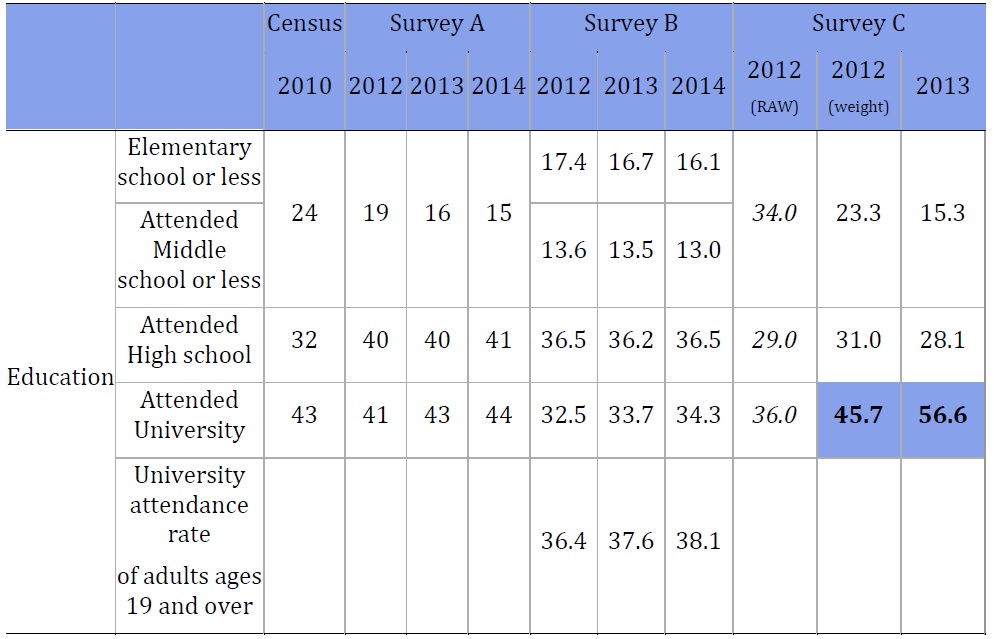
Education. Education levels were not stable in Survey C. According to the census, 43% of Korean adults have attended a university. In 2012 (unweighted), only 36% of Survey C’s respondents had attended university. In 2013, that jumped to 56.6%. Less educated people were under-represented in both Survey A and Survey C. The census shows that 24% of Koreans adults have not attended high school (elementary or middle school only). In 2013, Survey A included 16% in these categories and Survey C included 15.3%.
.jpg)
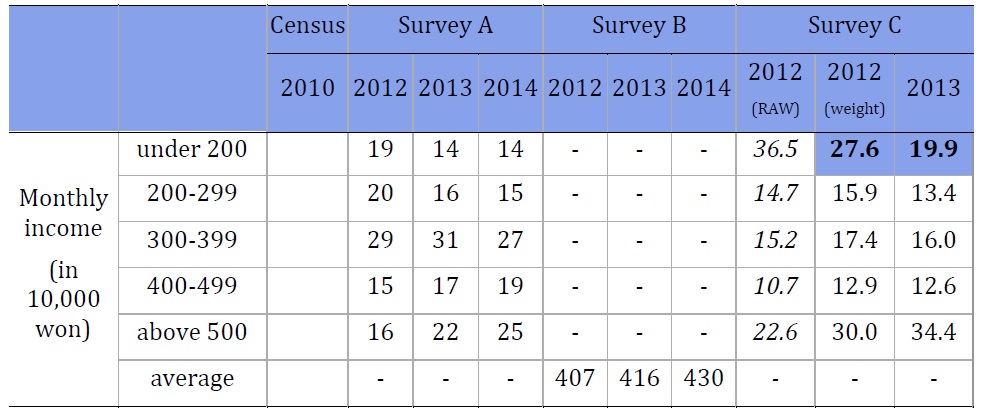
Income. Finally, there were some discrepancies related to income between Survey A and Survey C. Unfortunately, in this case, it is difficult to tell whose data is more accurate. The Korean census does not collect data about income. Survey B only provides the average national income in its results and the meta-data required to find the percentage of respondents that fell into each income category was not made available to us. The trend seemed to be that Survey C had more respondents in the bottom income category (under 2,000,000 won/month or approximately $1700US) with 27.6% (weighted 2012) or 19.9% (2013) and the top income category (over 5,000,000 won per month or approximately $4300US) with 30.0% (weighted 2012) or 34.4% (2013) compared to Survey A’s 22% in 2013. Survey A had more respondents in the middle-income range of 3,000,000-3,990,000 ($2600-$3400 US/month) with 31% in 2013 compared to Survey C’s 16%.
.jpg)
Discussion
The influence of each of these individual demographic variables on public opinion is not clear. More research could be done to understand, for example, the effect of household size on various topics. In general, the demographic variables that are believed to have a more profound impact on opinion are the ones that Survey A created quotas for, i.e., age, sex, and geographic area. However, any large deviations from census data suggest that there may be some kind of error, likely due to the sampling method in Survey A or to nonresponse error in Survey C.
Biographical Notes
Sung Kyum CHO is a professor in the Department of Communication at Chungnam National University and director of the Center for Asian Public Opinion Research & Collaboration Initiative (CAPORCI). He was the first president of the Asian Network for Public Opinion Research (ANPOR). He has also been president of the Korean Association for Survey Research (KASR) and is currently the president of the Korean Society for Journalism and Communication Studies (KSJCS). He is part of a team that has just started conducting the Korean Academic Multimode Open Survey (KAMOS). He is also an associate editor and publisher for the Asian Journal for Public Opinion Research (AJPOR).
He can be reached at Chungnam National University, Department of Communication 99, Daehak-ro, Yuseong-gu, Daejeon, 305-764 or by email at skcho@cnu.ac.kr.
Deok-Hyun Jang is the senior manager of Gallup Korea. His fields of research are election polls and survey methodology including mixed mode design. He earned his MS degree in communication from Korea University, and his doctorate in marketing from Soongsil University.
He can be reached at Research Planning Team, Gallup Korea, 70 Sajik-Ro Jongno-Gu Seoul Korea or by email at dhjang@gallup.co.kr.
Sarah Prusoff LoCascio is an associate editor and journal coordinator for the Asian Journal for Public Opinion Research (AJPOR). She earned her master’s degree from Indiana University in Bloomington, IN, USA and her bachelor’s degree from Bard College at Simon’s Rock in Great Barrington, MA, USA.
She can be reached at Center for Asian Public Opinion Research & Collaboration Initiative, Chungnam National University, Department of Communication 99, Daehak-ro, Yuseong-gu, Daejeon, 305-764 or by email at sprusoff@umail.iu.edu.
Correspondence
All correspondence concerning this article should be addressed to Sung Kyum Cho at Chungnam National University, Department of Communication 99, Daehak-ro, Yuseong-gu, Daejeon, 305-764 or by email at skcho@cnu.ac.kr.