
Modern consumers have been acquiring immense concerns for environmentally-related issue in the past decades (Dangaiso, 2024; Pancić et al., 2023). Businesses, consequently, must operate under pressure of anticipating sustainable and green products accompanied by secure commitments for sustainability. Resilience-based firms provide faithful efforts with the purpose of strengthening green brand equity. According to Nguyen and Nguyen (2021), businesses understand that consumers are more prone to purchase goods and services from companies with a higher level of environmental commitment. Therefore, green marketing procedures have been incorporated by firms with the purpose of enhancing green brand equity and furthermore, achieving a competitive advantage (Delafrooz & Goli, 2015). The dedication to environmental sustainability will yield a competitive advantage, prompting a company to cultivate an eco-friendly image for its products and services.
Generally, companies must put significant efforts into increasing sales by addressing products’ environmental impact (Qayyum et al., 2023). Green marketing urges businesses to adapt to the sustainability movement with a gradual increase in importance of green brand equity. Scholars discovered that green brand equity represents organizational success in acquiring business effectiveness (Gorska-Warsewicz et al., 2021; Sheykhan et al., 2024) and improving the firm’s value (Ha, 2021). Nevertheless, with the increasing trend in sustainable product perception among consumers, it is necessary for researchers to conduct studies on the changing dimensions of green brand equity (Dangaiso, 2024; Nguyen and Nguyen, 2021; Wadyatenti & Pranatasari, 2025). Developing countries, like Vietnam, witness a limited number of studies about green marketing strategies in general and in green brand equity specifically; thorough research about categorizing different targeting approaches for a green marketing strategy is needed (2023; Nguyen, 2023). In the Vietnamese fashion market, the annual production of textiles and dyeing processes generates approximately 92 million tons of waste (Ministry of Industry and Trade of Vietnam, 2021). Therefore it poses a challenge for implementing procedures for handling with environmental issues such as: water pollution, emissions, and waste treatment. According to reports from Vietnam Textile organization (2023), the green movement for fashion (green fashion) appears to be an emerging trend for development. Theoretically, existing research related to sustainability in Vietnam often focuses on broader topics like corporate social responsibility initiatives, sustainable business practices, or policy issues related to green growth (e.g., clean energy, ESG adoption, circular economy models). Studies that specifically isolate and measure the components of a Vietnamese Green Brand Equity model – such as green brand awareness, green brand image, green perceived quality, and green loyalty – are less common (Ha et al., 2022; Le et al., 2024).
This study was conducted to fill the research gap. By employing mixed methodologies (qualitative and quantitative approaches) and concentrating on the green fashion market in Vietnam, we would like accomplish two things: (1) to confirm the contribution of different green brand equity dimensions and (2) to analyze the causal relationships among these dimensions. Primary data has been obtained via a questionnaire while bibliometrics analysis was employed, using secondary data. The research findings provide considerable insights about green marketing dimensions relationship and the impacts on enhancing green brand equity. Besides the contributions to theory, there are practical implications to the study. Green brand perceptions are the centerpiece to modern business sustainability communication, especially within the context of the global green transition. They are critical because they directly link a company’s environmental claims to its financial viability and long-term reputation (Lopes et al., 2024). More essentially, modern businesses rely on authenticity and credibility for building public opinion in the world of viral communication. Consumers are looking for evidence that a brand’s sustainability claims are genuine and integrated throughout its operations rather than forces that drive crowd attitudes falsely. Generally, green brand perceptions (equity, image, satisfaction, or trust) must be empirically investigated under the circumstance of growing public attention for green transformation (Dangaiso, 2024). Asian customers – as a whole - with higher-than-ever knowledge about green brand equity, are requiring authentic and credible actions from businesses, which poses a challenge for operations (Yao et al., 2021). Green marketing – green brand equity urges businesses to quickly adapt the sustainability movement while gradually increasing the importance of green brand equity. With the purpose of considering green marketing’s impact towards green brand equity, which drives public attention enormously, this study has been conducted to provide empirical findings about the relationship among green marketing factors: Green brand image, green brand satisfaction, green brand trust, and green brand equity.
Literature Review and Hypotheses
Bibliometric Analysis
We conducted a bibliometric analysis from the Scopus database. This database offers tools for information management and fulfills additional criteria, including citation counts and accessibility, rendering it among the most utilized in this type of literature analysis (Donthu et al., 2021). In addition to its accessibility, Scopus is regarded as a valid, reliable, and timely source of academic information, which provides access to high-quality scientific documents (Donthu et al., 2021). Bibliometric analysis facilitated the identification of permanent data, the exploration of new research, scientific journals, and investigations within the relevant field.
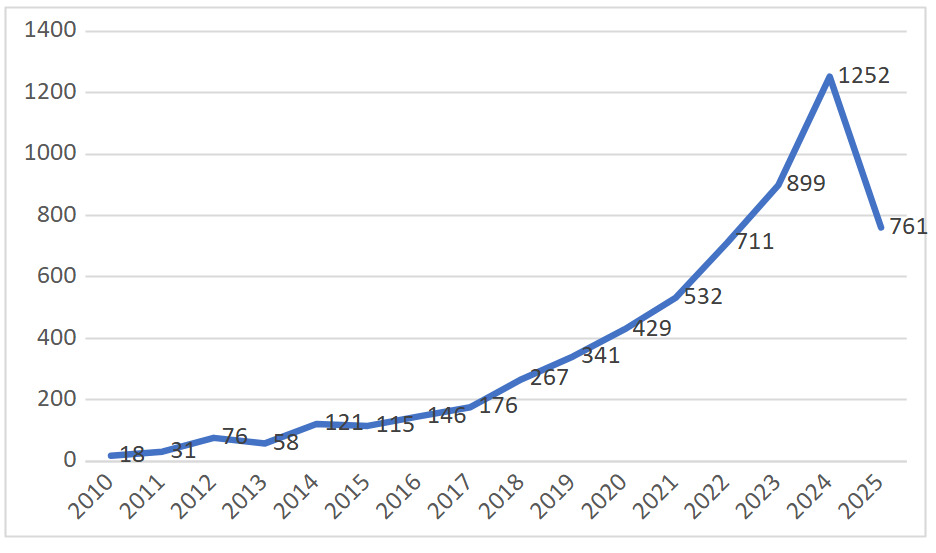
The bibliometric analysis of documents published by year related to green brand image, green satisfaction, green trust, and green brand equity reveals a clear upward trend in scholarly interest over time, followed by a gradual decline (see Figure 1). From 2010 to 2015, the number of publications remained relatively low, fluctuating between 18 and 146 documents annually. However, beginning in 2016, there was a steady increase in research output, peaking dramatically in 2024 with 1,252 documents, the highest number recorded. This surge reflects a growing academic and societal concern for sustainability and green branding topics, likely influenced by global environmental movements and consumer awareness.
Although there was a decline in 2025 (761 documents), the overall volume remains significantly higher than in earlier years, indicating that the field continues to attract substantial attention. The peak in 2024 and sustained interest in 2025 underscore the relevance and urgency of green-related branding research, suggesting it is a maturing field with both academic and practical significance.

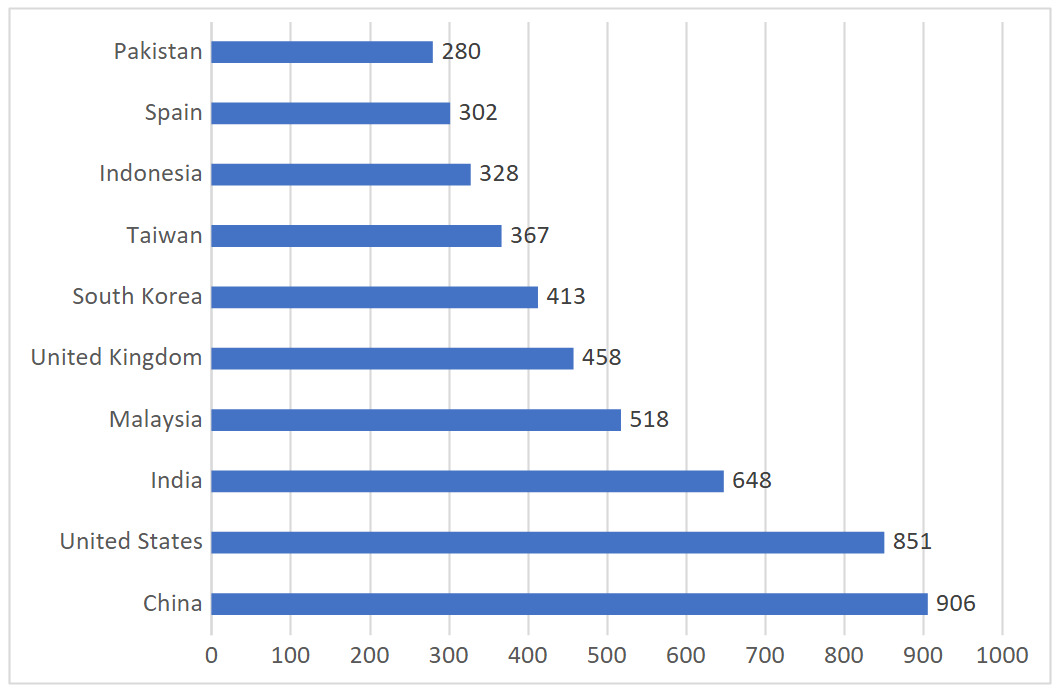
In addition, the bibliometric analysis of documents by country reveals that research on green brand image, green satisfaction, green trust, and green brand equity is predominantly concentrated in a handful of countries, with China (906 documents) and the United States (851 documents) leading the field. Other notable contributors include India (648), Malaysia (518), and the United Kingdom (458). Moreover, other Asian countries like South Korea (413), Taiwan (367), Indonesia (328), and Pakistan (280) also appear in the top ten (see Figure 2).
Nevertheless, Vietnam is notably absent from the list. This absence indicates a significant research gap in the Vietnamese context, despite growing environmental concerns and a rising demand for sustainable consumption in the country. The lack of Vietnamese representation suggests that academic and industry efforts in Vietnam may not yet be sufficiently aligned with global research trends in green branding. This gap presents a valuable opportunity for Vietnamese scholars to contribute original insights by exploring how local consumers perceive green brand equity and sustainability-related trust and satisfaction. Furthermore, localized studies could help inform green marketing strategies that are culturally and economically tailored to the Vietnamese market, thereby strengthening both academic relevance and practical application.

Green Brand Equity
Aaker (1996) defines brand equity as a collection of brand assets and liabilities associated with a brand, its name, and its symbol, which either enhance or diminish the value offered by a product or service to a company and its consumers. Attaching “green” to “brand equity,” green brand equity leverages consumer concern for the environment to foster stronger brand relationships, command premium pricing, and gain a competitive advantage in the marketplace (Ha, 2021). Generally, a brand’s environmental obligations and liabilities are referred to as green brand equity. Although antecedents of green brand equity are plentiful, there are three major categories supported by studies, namely: green brand image, green brand satisfaction, and green brand trust (Ha, 2021; Hartmann et al., 2005).
Green Brand Image
Green brand image is related to the experience and knowledge possessed by consumers about a green brand (Chen, 2010). This should be the visualization of a specific brand and remembered by consumers. Purchasing green products/services enables consumers to have a chance of using them, and after that, a green brand image would have been created (Butt et al., 2017). More precisely, green brand image comprises a synthesis of perceptions, which have already entered consumers’ mind and had an impact (Nguyen, 2023). A favorable image will influence consumer views in a number of ways, including the degree of confidence that leads to enhancing customers’ recall of green brand equity.
Green Brand Satisfaction
Green brand satisfaction should be considered an important variable in relationship-finding research for green brand equity. This concept relates to subjective and positive perceptions that consumers acquire after the process of interacting with products (Shakir et al., 2021). Green brand satisfaction is a specialized form of customer satisfaction within the context of sustainability and specifically pertains to a consumer’s positive subjective judgments and feelings resulting from a brand’s perceived fulfillment of environmental promises and pro-environmental initiatives (Gelderman et al., 2021). Therefore, green satisfaction refers to the pleasurable level of consumption-related fulfillment, which may satisfy a customer’s environmental desires, sustainable expectations, and need to support environmental sustainability (Gil & Jacob, 2018).
Green Brand Trust
Green brand trust is important in green marketing for estimating consumer behavior. This concept relates to the consistent belief and confidence possessed by a buyer in the marketing for a brand environmental commitment (Chen & Chang, 2013). Similarly, green brand trust also originates from brand trust and belongs to environmental sustainability and organizational claims regarding eco-friendly practices and products. Scholars define green trust as the willingness of consumers to depend on a brand’s product or service, stemming from their belief in its environmental commitment declared to the public (Alamsyah & Febriani, 2020). This is particularly important in the modern context, where skepticism from consumers is becoming more significant.
Resource-Based View (RBV) Theory in the Context of Green Marketing
Resource-based view (RBV) theory (Barney, 1991) provided a foundation study for researching green brand equity, which states strategic intangible assets, like brands, shape consumer perceptions, trust, and loyalty, creating long-term value. This approach sees brand-related constructs like image, satisfaction, and trust as relational and reputational resources that boost brand equity and a firm’s asset base. Further studies by Hartmann et al. (2005), Chen (2010), and Bekk et al. (2016) explained that green brand equity is substantially influenced by specific green-focused precursors, most notably green brand image, green satisfaction, and green trust. Green brand image acts as the foundational cognitive input, influencing both green satisfaction (the affective evaluation of a brand’s ecological performance) and green trust (a consumer’s willingness to rely on a brand’s environmental promises) (Akturan, 2018).
Generally, adopting a green brand position is a powerful strategy for firms to differentiate their offerings and secure a competitive advantage. This strategic position develops green brand equity, which functions as a valuable intangible asset. Green brand equity enhances consumers’ perceptions, causing a firm’s green products to be seen as inherently more valuable or desirable than competitors’ products. Therefore, research consistently demonstrates a sequential and hierarchical relationship among green brand equity and green marketing dimensions. A positive green brand image builds green trust, which, when combined with green satisfaction, culminates in heightened green brand image (Ha et al., 2022). This development in green brand equity, in turn, drives valuable behavioral outcomes such as premium purchase intention and positive word-of-mouth communication, solidifying green brand image, green satisfaction, and green trust as critical mediating pathways for businesses seeking to translate corporate environmental strategy into sustained competitive advantage and strong consumer relationships (Wadyatenti & Pranatasari, 2025).
Consequently, the relationship among the three antecedents of green brand equity have been shown in numerous studies. Our study adopts the research model of Chen (2010) and Bekk et al. (2016) in which green brand satisfaction and green brand trust serve as mediators for the relationship between green brand image and green brand equity. The proposed research model can be seen in Figure 3.
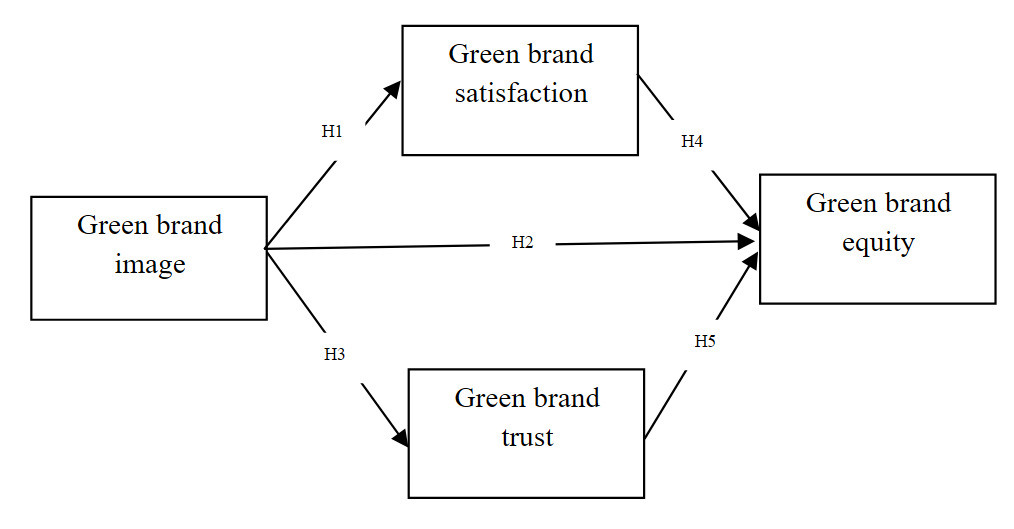
H1: Green brand image has a positive relationship with green brand satisfaction in the fashion market in Vietnam.
Green brand image and green brand satisfaction have been positively correlated in several studies. Shakir et al. (2021) showed that green brand image contributes significantly to the process of acquiring green brand satisfaction, as it increases the intention of potential and existing customers to buy. Waqas et al. (2023) also investigated and produced the similar results; customers’ green brand satisfaction is triggered by green brand image.
H2: There is a positive relationship between green brand image and green brand equity.
Green brand equity has been provided under an antecedent. In addition, there is an interesting finding, inferred from Dangaiso (2024), indicating that green brand image acts as a mediating variable between green brand satisfaction and green brand equity. As green brand satisfaction increases, green brand image also increase and moves in-line with green brand equity.
H3: Green brand image is positively correlated with green brand trust.
Studies illustrate a positive and significant influence of green brand image on green brand trust. Chen (2010) established green brand trust as a consumer’s confidence in a company’s product, service, or brand due to their belief in the reliability, goodness, and efficacy of that company’s demonstrated commitment to environmental protection. De Sio et al. (2022) regarded green brand trust as a mediator and it implicitly supports the idea that a strong green image (often influenced by advertising) would contribute to this trust, leading to purchase intentions.
H4: There is a positive relationship between green brand satisfaction and green brand equity.
Green brand satisfaction may be positively related to green brand equity. It is important that when there is an increase in green brand satisfaction, consumers may be more pleased about the green product, especially with green fashion. Therefore, overall green brand equity should go up (Ha et al., 2022).
H5: Green brand trust and green brand equity are positively correlated.
Green brand trust reflects a consumer’s willingness to rely on a brand based on their belief in its environmental competence, benevolence, and integrity (Malik et al., 2022). When consumers trust that a brand genuinely adheres to environmentally responsible practices and delivers on its green promises, this trust acts as a powerful lever for building brand equity. Empirical studies have shown that green trust directly and positively influences green brand equity (Dangaiso, 2024; Ha et al., 2022).
Additionally, we would like to test the mediation impact with 2 hypotheses as follows:
H6: Green brand satisfaction mediates the relationship from green brand image to green brand equity.
H7: Green brand trust mediates the relationship from green brand image to green brand equity.
Research Methodology
The conceptual research model is based on resource-based view (RBV) theory (Barney, 1991) and other studies such as Chen (2010) and Bekk et al. (2016) to investigate the relationship among green brand image, green brand trust, green brand satisfaction, and green brand equity, especially in the context of the Vietnamese fashion market.
Quantitative analysis and SmartPLS 4.0 software were utilized. A structured questionnaire, using a 5-point Likert scale, asking customers of one of several Vietnamese green fashion brands about that brand, was developed to collect empirical data (Table 1), which was distributed to a non-probability convenience sampling method from March 1, 2025 to March 15, 2025. The survey link was distributed through two channels:
-
Directly to customers at the stores of a number of green fashion brands
-
Via a link to Google Drive shared in selected online green fashion communities or social media groups focused on one of the selected fashion brands
The population was Vietnamese customers with a minimum of six months’ experience with green fashion. A total of 400 responses were submitted; after data screening, 373 responses were deemed suitable for further investigation. The questionnaire survey includes 16 items, thus, a minimum of 80 observations is necessary for the sample size because the sample size was determined based on the ratio of observations to the number of items in the model (Hair et al., 2019). Consequently, the 373 respondents met the requirement of sample size in quantitative method.
In terms of ethical considerations, the questionnaire does not request personal information or sensitive topics. All data will be kept secret and used exclusively for research reasons. Participants were thoroughly apprised of the study’s objectives and methodology, with an emphasis on their voluntary involvement. Participants also had the freedom to withdraw at any point without repercussions.
Research Results and Discussion
Descriptive Analysis
First of all, the gender distribution is relatively balanced, with slightly more females (48.5%) than males (46.7%). A small proportion of respondents (4.8%) preferred not to disclose their gender. This balance suggests that gender bias is minimal, and perspectives from both male and female participants are well represented. The characteristics of the sample are presented in Table 2.
Moreover, a plurality of respondents (34.6%) are in the 25–34 age range, followed by those aged 35–44 (27.6%). Younger participants (under 18) make up a small portion (5.9%), indicating that the survey primarily attracted working-age adults. Most respondents earn between 26,000,001 VND – 39,000,000 VND (1,001 –1,500 USD ) per month (34.6%), followed by 13,000,001 VND – 26,000,000 VND (501–1,000 USD) (29.0%). Only a small fraction earns above 52,000,000 VND (2,000 USD) (3.2%), suggesting the sample leans towards middle-income individuals. This spread helps ensure that views from different age and economic backgrounds are included. Over half of the respondents (53.1%) have shown interest in green fashion for under 1 year, with the highest group being those between 6 months and 1 year (32.4%). This suggests a growing and recent awareness or curiosity toward green fashion among the population. Finally, in term of popular green fashion brands, the greatest number of respondents were Metiseko customers, with 104 respondents (accounting for 27.9%). Archieve Sashiko was second, accounting for 26.0% of respondents. Timtay and Root Rotation account for 19.6% and 22.2% of respondents, respectively.
Reliability Analysis
The reliability analysis of the research items demonstrates that all four constructs - green brand equity, green brand image, green satisfaction, and green trust - exhibit strong internal consistency and convergent validity. Specifically, Cronbach’s alpha (α) values range from .70 to .90, indicating acceptable to excellent reliability. Composite Reliability (CR) values are consistently high, all at or above .8, while Average Variance Extracted (AVE) values are uniformly .70, surpassing the recommended threshold of .50. Item loadings for all constructs are also robust, with all indicators exceeding .70 and many above .80, confirming that individual items are strongly associated with their respective latent variables (see Table 3).
Among the constructs, Green Brand Image stands out with the highest reliability metrics (α = .90, CR = .90, loadings up to 0.89), suggesting a particularly well-measured dimension. Although Green Trust has a slightly lower Cronbach’s alpha (.70), its high CR (.90) and strong item loadings (up to .87) affirm its reliability. Overall, the measurement model is statistically sound, and the constructs are reliable for further analysis, such as structural equation modeling or hypothesis testing.
Discriminant Validity
The discriminant validity of the constructs was assessed using the Fornell-Larcker criterion, and the results in the table indicate that discriminant validity is adequately established. In Table 4, the square roots of AVEs are as follows: Green brand equity (0.85), green brand image (0.87), green satisfaction (0.89), and green trust (0.86). Each of these values is higher than the off-diagonal correlation coefficients in the corresponding rows and columns, such as the correlation between green satisfaction and green brand image (0.79), or green trust and green brand equity (0.68). This confirms that each construct shares more variance with its own indicators than with other constructs, supporting the discriminant validity of the measurement model. These findings suggest that the four constructs are conceptually distinct and that the measurement model can reliably distinguish between them.
Partial Least Square Structural Equation Modeling Results
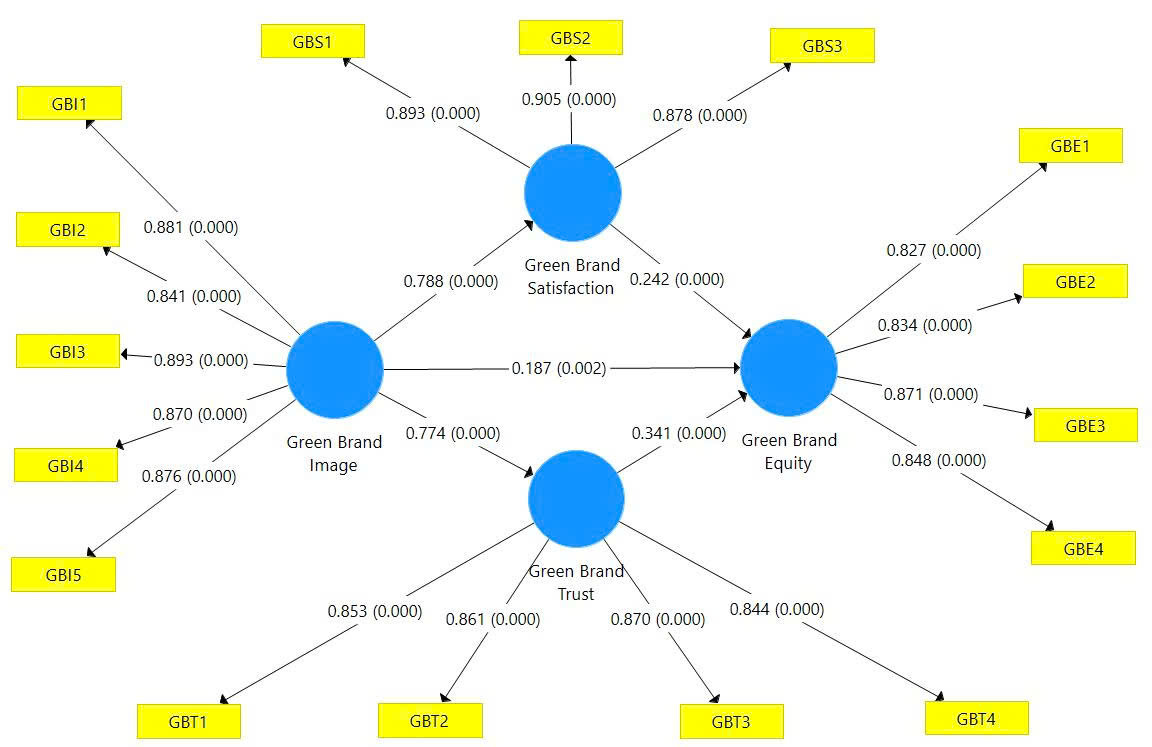
The results of the path analysis indicate that all proposed hypotheses (H1–H7) are statistically supported (see Figure 4 and Table 6), with all path coefficients being positive and significant at p < .001.

Among the strongest relationships, green brand image significantly influences green brand satisfaction (β = .79) and green brand trust (β = .77), confirming that a positive environmental image plays a critical role in shaping both satisfaction and trust among customers. While green brand image also has a direct effect on green brand equity (β = .19), its influence is relatively modest compared to its indirect effects through satisfaction and trust. Additionally, both green brand satisfaction (β = .24) and green brand trust (β = .34) directly affect green brand equity, suggesting that emotional responses and confidence in the brand are essential drivers of perceived brand value.
The indirect effects of green brand image × green brand satisfaction on green brand equity (β = .19) and green brand image × green brand trust on green brand equity (β = .26) are both positive and statistically significant. Moreover, the t-values of these two indirect relationships are 3.51 and 4.56 respectively. The findings suggest that green brand image significantly enhances brand equity, particularly when customers exhibit elevated levels of satisfaction and trust in the brand.
Finally, the R-square result (Table 5) demonstrates that the structural model accounts for a moderate to significant proportion of variation in the dependent variables. Green brand equity exhibits an R² value of .51, indicating that green brand image, green brand trust, and green brand satisfaction can explain 51.2% of green brand equity. Likewise, green brand satisfaction (R² = .40) and green brand trust (R² = .39) indicate that about 40% of green brand satisfaction and 39% of green brand trust are explained by green brand image, respectively. These R² values demonstrate moderate explanatory power, signifying that the model possesses enough predictive relevance for evaluating the links among green brand attributes (Hair et al., 2019).
Discussion
According to the abovementioned results, several important findings can be inferred. First of all, while all seven hypotheses are supported, two relationships, that is, green brand image > green satisfaction and green brand image > green brand trust are particularly strong (with the p-value of .788 and .774 respectively) which indicate the strongly related connections. To be more interpretive, strong green brand image fundamentally functions as a powerful expectation horizon for consumers, consistent with Topcuoglu et al. (2022). When a firm has already cultivated a favorable perception of its environmental commitment, consumers approach its offerings preloaded with positive anticipation. This initial goodwill means that if the product’s actual performance and documented ecological benefits meet or surpass this high baseline, the resulting emotional reward is amplified, leading to heightened green satisfaction. Therefore, the image effectively is enhanced for the experience; it defines the standard against which success or failure is measured, making satisfaction a direct function of the congruence between the communicated image and the delivered reality (Watson et al., 2024). In addition, a well-established green brand image is not built on a singular campaign but on a consistent, tangible track record of eco-friendly practices. This history of demonstrable action gives the brand an organizational legitimacy that makes its environmental claims inherently more believable than those from competitors making vague or unsupported statements. In this relationship, the image serves as the historical ledger of commitment, which consumers rely on to reduce perceived risk and justify their decision to place their faith—their trust—in the brand’s future ecological promises (Wahyoedi et al., 2022).
Second, green brand image not only has a significant impact on green brand satisfaction and green brand trust but also has a slight impact on green brand equity. Although the relationship is not extremely strong, the result should not be ignored. Academic literature overwhelmingly supports the direct and significant positive relationship between green brand image and green brand equity. Specifically, in the situation of green marketing, when consumers perceive a brand as genuinely green and environmentally responsible, which implies a strong green brand image, they often associate it with higher quality, ethical production, and unique value propositions. This perception of superior green quality and value directly contributes to increased green brand equity (Nguyen-Viet, 2023). Generally, green brand image is not merely a superficial marketing tool but a strategic asset that directly and indirectly builds green brand equity. By consistently communicating authentic environmental commitments and implementing sustainable practices, brands can cultivate a strong green image that translates into greater consumer trust, satisfaction, and ultimately, a more valuable and competitive brand in the eco-conscious marketplace (Delafrooz & Goli, 2015).
Beside green brand equity, green brand satisfaction and green brand trust have an impact on green brand equity, with the coefficient value of .242 and .341 respectively. These two factors have also been identified as strong indicators of green brand equity and interestingly, have larger effects than green brand image. A possible explanation is that green brand image represents a comprehensive, historical canvas of environmental commitments, making its establishment a prolonged process. Conversely, both green satisfaction and green trust are inherently experiential and affective, meaning they are acquired and modified faster and at a more granular customer scale. A customer’s trust can be quickly gained or lost based on a single transparent action, and satisfaction is an immediate, utility-based verdict following consumption. This temporal advantage means that, at the level of individual customer sentiment, green satisfaction and green trust provide more sensitive and immediate feedback on the efficacy of a brand’s green strategy than the long-term, abstract green brand image (Gorska-Warsewicz et al., 2021; Mehdikhani & Valmohammadi, 2022). When consumers experience satisfaction with a green product – meaning the product delivers its promised functional and environmental benefits – it triggers a powerful reinforcing feedback loop. This contentment is not merely a transient feeling; it actively strengthens and solidifies the mental associations linking the brand to its green attributes.
Last but not least, our study found two mediation effects from:
-
Green brand image*green brand satisfaction> green brand equity;
-
Green brand image*green brand trust> green brand equity
Beside the direct relationship, green brand image can be reinforced in two ways through green brand satisfaction and green brand trust. As mentioned above, green brand image can be established after the individual customer forms an opinion about satisfaction and trust. Satisfied consumers are more likely to exhibit favorable behavioral intentions, such as repeat purchases, positive word-of-mouth recommendations, and resistance to competitive offerings. These behaviors directly contribute to different facets of green brand equity. Trust is a cornerstone of strong emotional connections between consumers and brands. When consumers trust a brand to act responsibly towards the environment, it resonates with their values, fostering a deeper emotional bond. This emotional connection leads to greater loyalty and advocacy, both significant contributors to green brand equity. With green brand trust, in the situation that consumers trust a green brand, they are more likely to perceive its products as higher in quality and value, specifically concerning their environmental attributes. This enhanced perceived value contributes directly to green brand equity by making the brand more desirable and competitive. Trust reinforces the belief that the green benefits are genuine and worthwhile (Akturan, 2018; Chen, 2010; Gelderman et al., 2021).
Conclusion
Our empirical findings show the relationships among green marketing dimensions: green brand image, green brand satisfaction, green brand trust, and green brand equity. The research scope is the Vietnamese green fashion industry, which provides insight into the green behavior of Vietnamese consumers in general. With the employment of non-probability convenience sampling and a PLS-SEM approach, we have shown that green brand equity is affected by three antecedents. Green brand trust and green brand satisfaction also act as mediators to the relationship between green brand image to green brand equity.
This study’s empirical findings offer several important implications and suggest future research directions in the area of green marketing and green brand equity. The growing focus on resilience and sustainability has made environmental concerns a central theme in modern research. Specifically, scholars are increasingly recognizing the trend toward green product development. Therefore, this research contributes to the existing theoretical review and provides empirical evidence relevant to the fashion industry and green products generally. Furthermore, this work re-investigates key green marketing factors, furnishing a theoretical framework regarding green brand image, green brand equity, green brand satisfaction, and green brand trust. More importantly, green marketing proves itself to be an effective procedure for businesses to follow, thus, it is mandatory to incorporate green marketing into green brand equity establishment. In addition to green marketing, green brand equity should be considered as a critical theoretical implication. Green equity refers to the intangible assets a company builds up as a result of customers’ views of its superior pro-sustainable actions. Customers’ collective perceptions, comprehension, and connections about a brand’s environmental obligations and concerns are all included. Positive or negative, this additional value affects how customers react to the brand, its goods, and its advertising. There are significant and varied ramifications for green brand equity research, as well as for customers seeking eco-friendly options as environmental consciousness rises internationally.
Finally, this study constructed a research methodology to further analyze the links between the four constructs – green brand image, green satisfaction, green trust, and green brand equity. The literature on brand management and green marketing is compiled in this study into a fresh managerial paradigm. The aforementioned empirical findings provide fresh insight for further study on the subject. As a final reflection, public opinion is further solidified when the consumption experience validates the message. This means successful green messaging must be substantiated by product reality. A well-crafted campaign followed by a disappointing product experience will lead to negative public opinion, regardless of the initial attractive image.