The Indonesian tourism sector has made use of technological developments, including the strengthening of the smart tourism concept that utilizes AI, big data analytics, and the Internet of Things to enhance tourist experiences and improve efficiency (Halim & Pramesti, 2025). Socio-economic dynamics, where aspects of a community and local culture become key elements in building tourism destination resilience, are also part of the development of Indonesian tourism (Hanita et al., 2024).
Tourism can increase employment opportunities and economic activities, while also improving basic infrastructure, including Internet access, although more inclusive strategies are required so that the benefits can be more evenly and sustainably distributed (Yuli et al., 2025).
Regarding sustainable tourism, a study conducted by Rahman et al. (2025) in Labuan Bajo and Komodo Island, Indonesia found that tourists assign different values and willingness to pay for green tourism programs. Another study conducted in Bali and Lombok, Indonesia shows that digital experiences influence awareness of sustainable tourism (Sukma et al., 2025), Furthermore, generational differences also play a role, as young generations tend to demonstrate a better understanding of sustainable tourism (Veronica, 2025). Although many studies have examined sustainable tourism, limited attention has been given to how emerging digital niches, such as esports tourism, shape tourism preferences, particularly among younger, digitally connected travelers. Therefore, comprehensive quantitative research is needed to examine differences in tourism preferences across demographic segments, cultural interests, sustainability orientations, and digital niches, particularly in understanding how these factors interact in shaping tourism decision-making. From a public opinion perspective, tourism preferences reflect collective attitudes, perceptions, and value orientations toward sustainable destinations, and local cultural engagement. Our study addresses this gap by employing a comprehensive quantitative approach to analyze how demographic, cultural, sustainability, and digital factors interact in shaping tourism preferences, with a particular focus on emerging digital niches such as esports tourism.
Research Questions:
RQ1: How are preferences for different types of tourism distributed across Indonesian tourists?
RQ2: How do socio-demographic factors influence preferences for different types of tourism?
RQ3: How do cultural interest and sustainability perceptions influence tourism preferences?
Literature Review
Tourist Segmentation and The Role of Socio-Demographics
Tourism literature widely views segmentation as a primary conceptual framework to explain the heterogeneity of tourist behavior, with socio-demographic factors serving not only as classification tools but also as a basis for understanding tourism decision-making mechanisms (Carvache-Franco et al., 2025; Dolnicar et al., 2018; Forleo & Bredice, 2025; Fu et al., 2025; Moisa et al., 2025).
Within the demographic dimension, age is consistently associated with differences in orientation, where younger tourists tend to pursue exploratory and novelty-seeking experiences, and more mature age groups show stronger preferences for safety and service quality (Dolnicar et al., 2018).
On the other hand, previous studies have demonstrated significant gender differences in motivations for engaging in domestic and international tourism (Alkohaiz et al., 2025). When addressing sustainable tourism management, women tend to adopt more holistic approaches and are more oriented toward reducing environmental risks (Torres-Delgado et al., 2025).
Cultural Interest in Tourism
Culture-based tourism is understood as tourism activities motivated by an interest to learn and experience both tangible and intangible cultural attractions, thus including visits to heritage sites and participation in local cultural practices (Richards & Marques, 2018). Religious tourism can be positioned as a form of cultural experience centered on travel to sacred places and religious experiences that often intersect with recreational elements (Terzidou et al., 2018). Zubiaga et al. (2024) emphasized that sustainable cultural tourism requires an indicator framework capable of capturing elements of local culture and conservation practices while considering social and environmental impacts in modern tourism destinations.
Sustainability Orientation in Tourism
Sustainability emphasizes reducing tourism’s ecological footprint and strengthening low-impact destination and tourism product governance, for example through the ecological footprint approach as an indicator and basis for managerial recommendations (Hunter & Shaw, 2007; Mancini et al., 2022). However, tourism practices often demonstrate an eco-value–action gap, namely a mismatch between pro-environmental values and attitudes and tourists’ actual behaviors (Juvan & Dolnicar, 2014).
A literature review study conducted by Alotaibi et al. (2024) showed how sustainable tourism practices can significantly influence tourist behavior and the quality of life of local communities, reinforcing that integrating sustainability into operational practices is key to transforming tourist behavior in the global context.
In this regard, scholars highlight a persistent attitude–behavior gap in sustainable tourism, indicating that positive environmental intentions do not always translate into sustainable travel behaviors (Wut et al., 2023). This highlights the need for integrated theoretical and policy interventions to bridge this gap (Hadinejad et al., 2025). These findings indicate that sustainability orientation may increase the likelihood of selecting nature-based tourism.
Tourism Category Preferences and New Forms of Tourism Categories
Emerging tourism categories such as esports tourism, immersive digital experiences, and themed tourism reflect the growing diversification of tourism preferences, particularly among younger and digitally connected tourists (Dulgaroglu, 2023). Immersive technologies including virtual reality and digital games increasingly shape destination experiences and tourism perceptions (Kim et al., 2018; Zhu et al., 2025). Recent studies have also demonstrated that XR-based tourism experiences may vary across user groups depending on age, prior XR experience, and technological affinity (Warsinke et al., 2026). In addition, themed tourism, such as luxury tourism, highlights the growing importance of personalization and emotional engagement in contemporary tourism experiences (Besser et al., 2024). These developments indicate that contemporary tourism segmentation increasingly involves digital lifestyle orientation and immersive experience preferences alongside traditional socio-demographic distinctions.
Hypotheses:
H1: Socio-demographic characteristics influence tourism category choices.
H2: Cultural interest increases the likelihood of choosing cultural tourism.
H3: Sustainability concern increases the likelihood of choosing nature-based tourism.

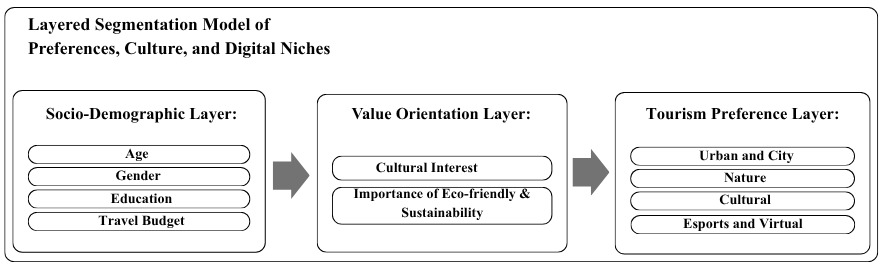
Figure 1 illustrates the conceptual research model and the layered structure of factors associated with tourism category preferences.
Research Method
Research Design
This study uses a cross-sectional survey design with a quantitative case study approach on Indonesian tourists. The case examined is how Indonesian tourists from different socio-demographic segments choose tourism categories, examine sustainability perceptions, and express their interest in local culture.
Population and Sample
The research population consists of individuals domiciled in Indonesia who have undertaken domestic and/or international tourism travel. A total of 1,030 valid respondents were collected. Respondents’ ages ranged from 17 to 75 years, with an average age of approximately 30 years. The respondents consisted of 595 women and 435 men. The full dataset can be accessed on Figshare: https://doi.org/10.6084/m9.figshare.31821367.
Data were collected through a cross-sectional online survey using Google Forms and distributed via non-probability snowball sampling through travel-related social media networks. Snowball sampling allows researchers to reach respondents who meet the research criteria, as active tourists are generally part of social networks and travel communities. This method enables the gradual expansion of respondents through participant recommendations, while also increasing data collection efficiency in populations that are difficult to map administratively (Ting et al., 2025). The survey was conducted between September 3 and October 8, 2024, and 1,030 valid responses were obtained.
Instrument and Questionnaire Constructs
The research questionnaire consisted of three main components, namely demographic characteristics, tourism preferences, and value-based attitudes. The initial list of 16 tourism categories was developed based on tourism segmentation and tourism typology literature. The categories were adapted to reflect contemporary tourism preferences and emerging tourism trends within the Indonesian context.
Tourism preferences were measured using multiple-response items:
Which types of tourism are you interested in?
The choice of tourism categories are cultural, religious, urban and city tourism, adventure, sports and outdoor activities, shopping tourism, culinary, health and wellness tourism, esports, extreme sports and adrenaline-inducing, natural scenery and environmental conservation, traditional tourism, luxury, archaeological sites, horror tourism, arts and crafts, science and technology tourism, and other. Each selected category is recoded into a binary variable (0 = unselected, 1 = selected).
Meanwhile, cultural interest was measured using single-item binary responses:
Are you interested in art, history, traditions, and the uniqueness of local cultures?
Sustainability items were measured using questions on a Likert-type scale of 1-5:
How important are eco-friendliness and sustainability for you in choosing a tourist destination?
Responses are categorized from 1 = very unimportant to 5 = very important.
Descriptive statistics were used to show the profile of respondents, Chi-square was conducted to examine the relationship between tourism preferences and socio-demographic and value-based variables, and logistic regression analysis was carried out to identify significant predictors related to the choice of tourism categories.
Variables
Independent variables included age, gender, education, travel budget, sustainability importance, and cultural interest.
Age was collected as a continuous variable and then categorized into four categories, namely emerging adults (17-24 years), young adults (25-34 years), middle-aged adults (35-49 years), and older adults (50 years and older), to be analyzed using the chi-square test.
Gender is coded as male and female. The level of education is categorized into three levels, namely high school or below, undergraduate education, and postgraduate education. Travel budget is measured as an ordinal variable based on holiday budget allocation. The importance of sustainability is measured on the Likert-type scale (1-5), and local cultural interests are coded as Yes and No.
The dependent variable is the selection of the tourism category of interest, recoded into binary variables.
Data Analysis Techniques
The collected data were cleaned, coded, and analyzed through three stages:
First, descriptive statistics were used to summarize respondents’ demographic characteristics and tourism preferences.
Second, Chi-square and Cramér’s V were used to see if there was a bivariate relationship between tourism preferences and socio-demographic variables or value-based variables.
Third, a binary logistics regression model was created separately, to look at the factors that influence the choice of urban and city, nature, culture, and esports tourism. These categories were chosen because they represents conceptually different layers within the segmentation framework. Urban and city, nature, and cultural tourism were selected because they showed substantial prevalence across respondents, while esports tourism was included as an emerging digital niche category among younger tourists.
To ensure consistency and comparability between models, the same set of predictive variables was included in each regression model, namely age, gender, education level, travel budget, sustainability importance, and cultural interests.
Categories with a relatively low prevalence are not modeled separately due to their scant distribution, which can reduce statistical power and result in unstable estimates.
Results
A series of binary logistic regression analyses were conducted to examine the effects of socio-demographic factors, cultural interest, and sustainability importance on tourism category preferences.
Descriptive Results
General Preferences for Tourism Categories
The four tourism categories most preferred by respondents are culinary, natural scenery, urban & city, and sports tourism. Culinary tourism ranks first (67.86%), followed by nature tourism (61.94%). This indicates that food and the experience of enjoying natural landscapes constitute the main foundation of tourism experiences for Indonesian tourists, regardless of age, gender, education level, or travel budget.
Meanwhile, more specific categories such as arts and crafts, archaeological sites, religious, luxury, science and technology, extreme sports and adrenaline-inducing, health and wellness, esports, and horror tourism have smaller proportions of interest, below 25%, and can be categorized as niche segments.
Cross-Demographic Patterns of Tourism Preferences
Descriptive patterns indicate that age differentiates preferences for urban, shopping, and adventure tourism, with younger respondents (17–34 years) showing stronger interest, while these preferences decline among older groups. In contrast, nature and conservation tourism remains consistently high across age groups, with a slight increase among respondents aged 35–44.
Both males and females demonstrate similarly high interest in nature and cultural tourism, indicating that these categories function as cross-gender attractions.
Respondents with higher education levels demonstrate stronger preferences for cultural and nature tourism, while higher travel budgets are associated with increased interest in urban and city tourism.
Cultural Tourism
Approximately 40% of respondents selected cultural tourism, with 86% of respondents reporting an interest in arts, traditions, history, and local cultural uniqueness, indicating that cultural orientation is more strongly expressed at the value level than in specific category choices. Cross-demographic patterns suggest that cultural tourism is more prominent among respondents with higher education and among middle-aged groups, while gender differences are minimal.
Cross-demographic patterns show that preferences for cultural tourism, religious tourism, and archaeological site tourism tended to be more prominent among respondents with higher education (undergraduate and postgraduate), and among 35–54-year-old respondents. Females expressed slightly more interest in arts and crafts, but both males and females are relatively balanced in cultural tourism in general. These findings, combined with the high declared interest in local culture, indicates that culture and history-based tourism has a strong potential as a key narrative element in destination development, especially if packaged in ways that are relevant to younger generations while still meaningful for adult and higher-educated groups.
Opportunities in Niche and Emerging Segments
Some niche and emerging segments show a distinctive pattern, with the esports category, while relatively low in aggregate, highly concentrated in young male travelers (especially 17-24 years old) and almost non-emerging in older age groups, reflecting the digital-native segment.
Logistic Regression Analysis Models
To analyze how socio-demographic factors and value orientation affect tourism preferences, binary logistics regression was carried out on four tourism categories, which are summarized in Table 1 below.
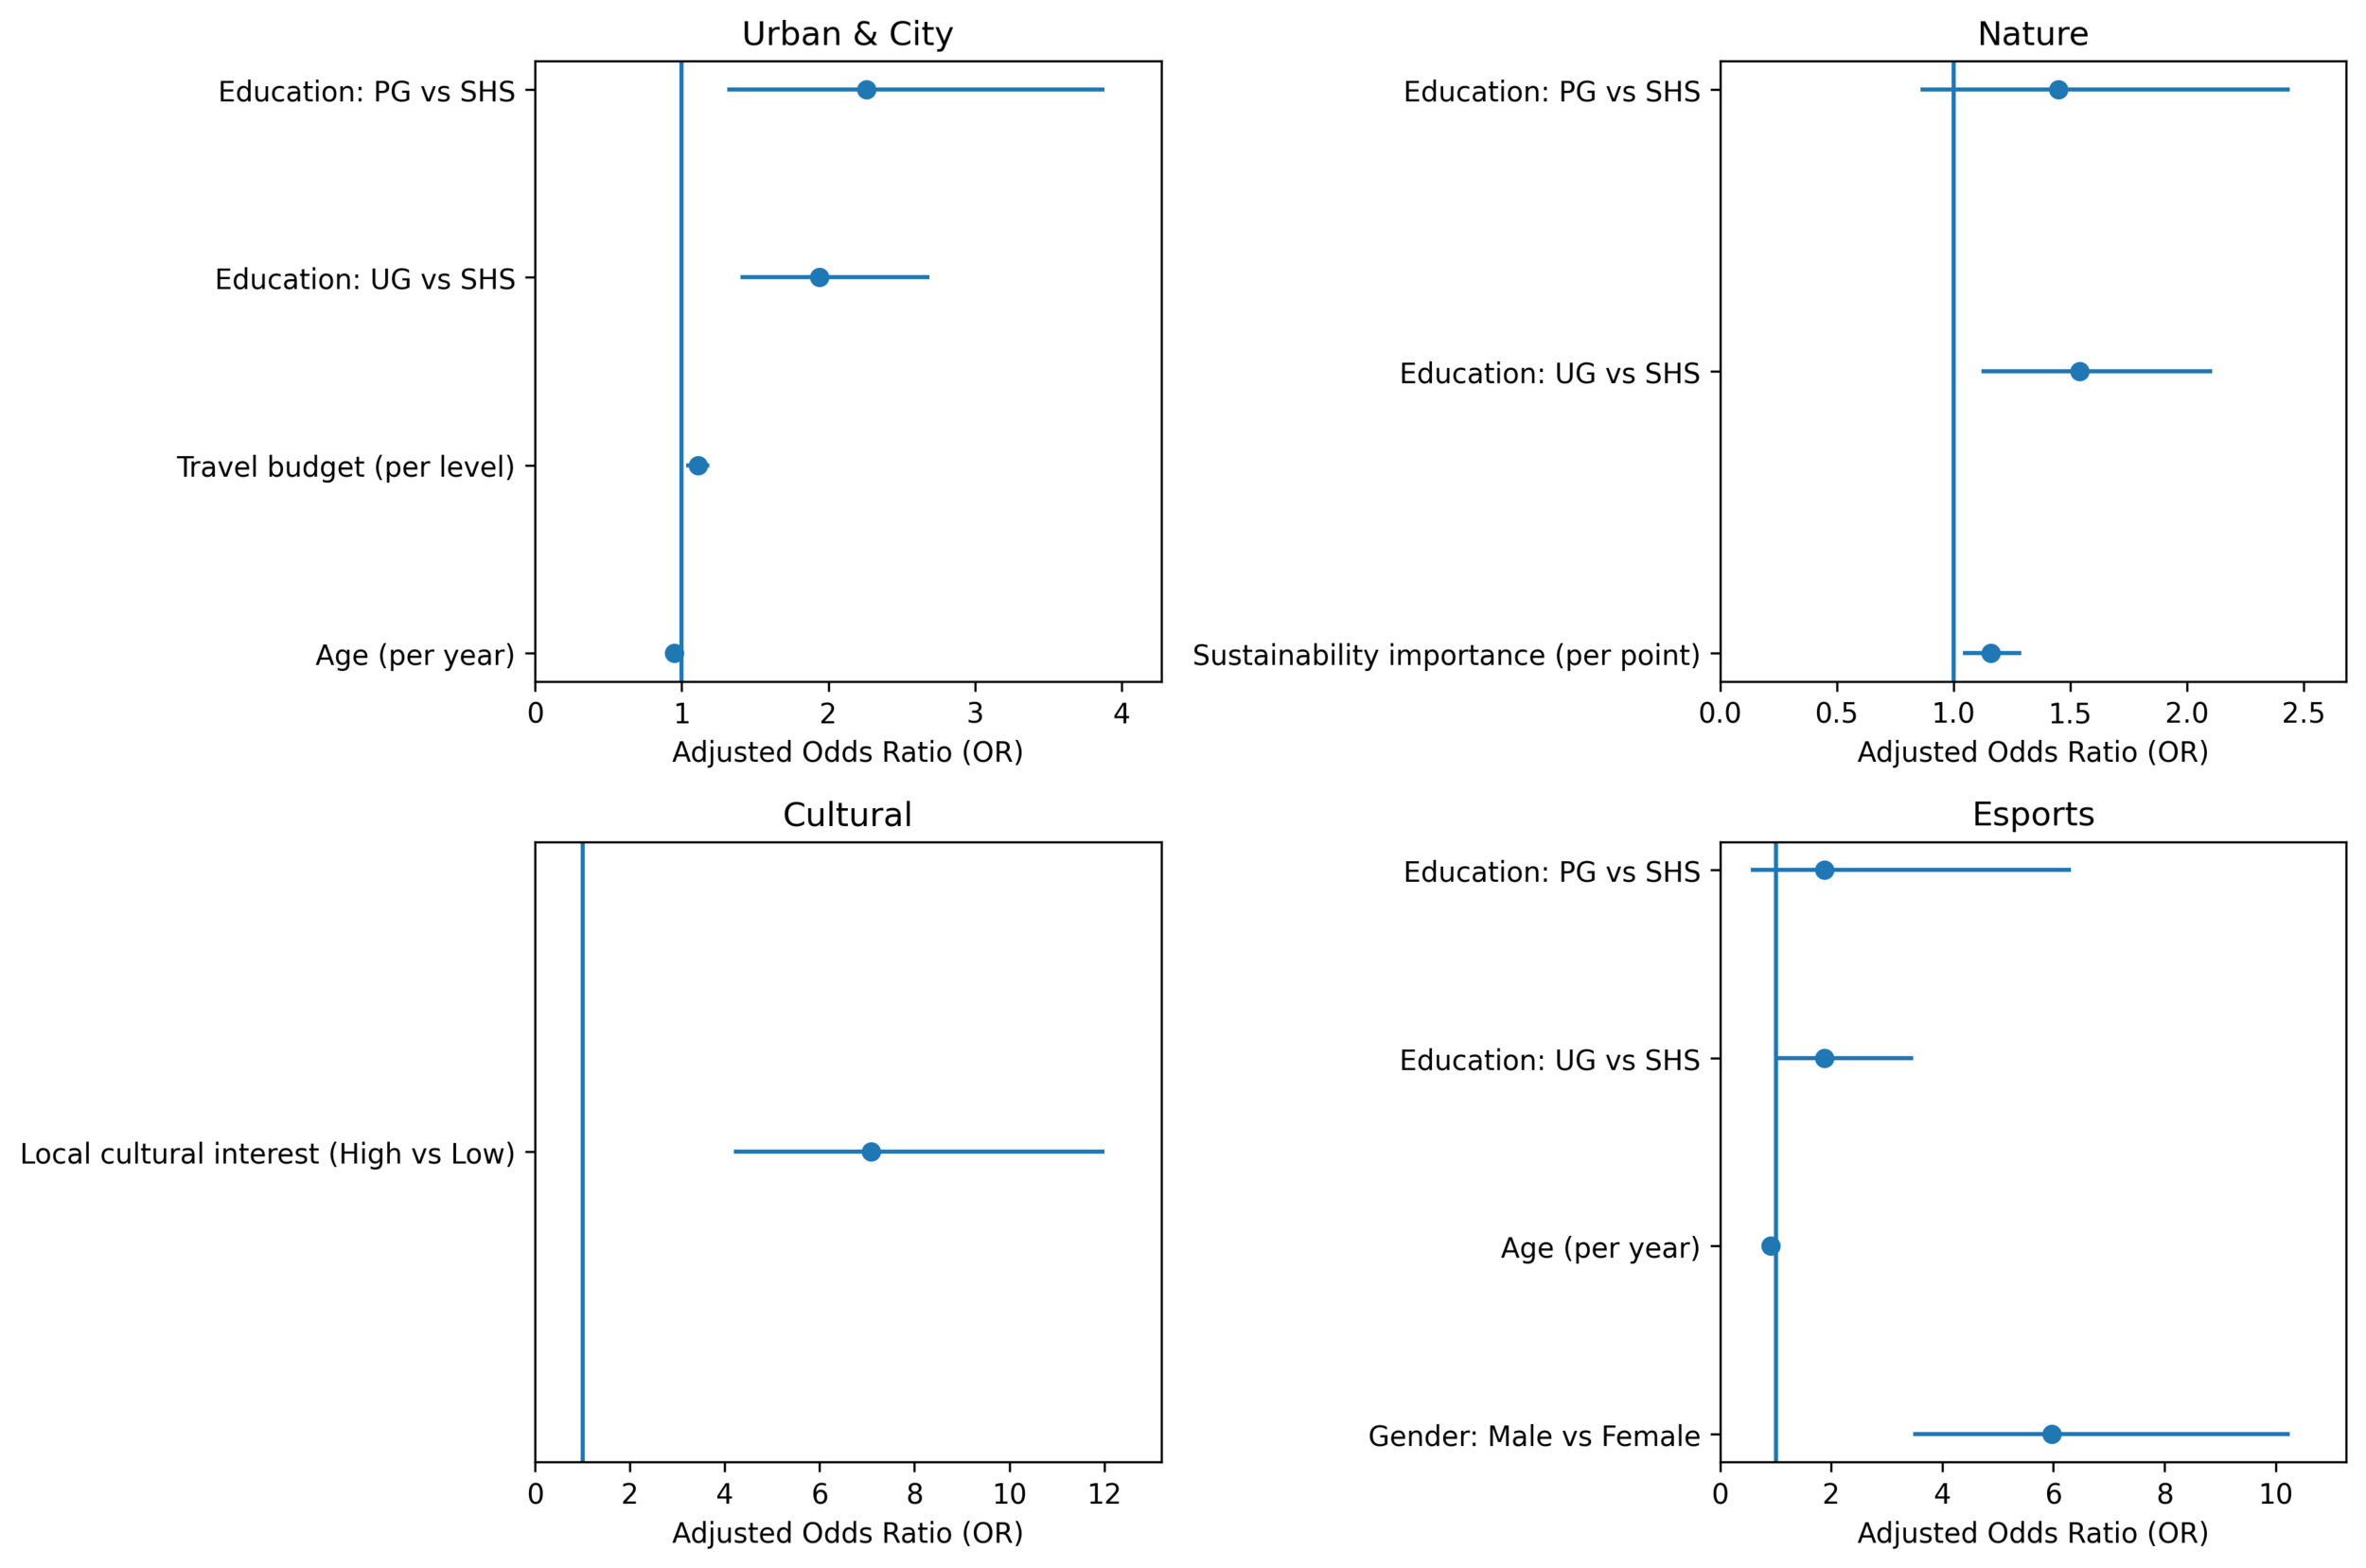
To facilitate interpretation of the regression results, Figure 2 presents the adjusted odds ratios and 95% confidence intervals for key predictors across tourism categories.

All logistic regression models were statistically significant based on likelihood ratio tests (p < .01), although explanatory power varied across models, with McFadden pseudo-R² ranging from 0.019 for nature tourism to 0.160 for esports tourism.
For urban and city tourism, younger respondents were more likely to select this category (AOR = 0.95, p < .001), indicating that the likelihood decreases with age. Respondents with higher education levels showed significantly greater adjusted odds of choosing urban and city tourism compared with those with senior high school education or below, particularly among diploma/undergraduate (AOR = 1.94, p < .001) and postgraduate respondents (AOR = 2.26, p = .003). Higher travel budget levels were also positively associated with urban & city tourism choice (AOR = 1.11, p = .004).
For nature and conservation tourism, sustainability importance was a significant predictor (AOR = 1.16, p = .006), indicating that respondents who place greater importance on eco-friendly and sustainability factors were more likely to choose this category. Respondents with a diploma or undergraduate education also showed higher odds compared with the lower education group (AOR = 1.54, p = .008).
For cultural tourism, the strongest predictor was local cultural interest (AOR = 7.09, p < .001). In contrast, education level was not statistically significant after controlling for other variables, suggesting that value orientation toward local culture is more influential than socio-demographic characteristics in explaining cultural tourism preference.
For esports tourism, younger age (AOR = 0.91, p < .001) and male gender (AOR = 5.97, p < .001) were strong predictors. Respondents with a diploma or undergraduate education were also more likely to choose esports tourism (AOR = 1.87, p = .047), although the effect was weaker than age and gender.
These findings support a layered segmentation structure in which socio-demographic characteristics are more strongly associated with urban and city and esports tourism, while value-based factors, such as sustainability concern and local cultural interest, are more strongly associated with nature and cultural tourism.
Chi-Square Results
To further examine the associations between tourism preferences and socio-demographic variables, as well as value-based variables, chi-square tests were conducted. The results are presented in Table 2.
Table 2 presents the chi-square test results examining associations between tourism preferences and selected socio-demographic and value-based variables. Travel budget and age were significantly associated with all tourism categories, indicating that financial capacity and life-stage influence tourism preferences. Gender was significantly associated only with esports tourism, whereas education level was significantly related to nature and esports tourism. Sustainability importance was primarily associated with nature tourism, while interest in local culture showed the strongest association with cultural tourism.
Discussion
Tourism preferences of Indonesian tourists are distributed in a layered manner. Consistent with tourism segmentation theory, socio-demographic characteristics function as structural differentiators that shape travel motivations, perceived risks, and consumption patterns across tourism categories (Carvache-Franco et al., 2025; Dolnicar et al., 2018).
However, their influence is selective rather than universal. Nature and cultural tourism function as cross-segment preferences, whereas urban and city and esports tourism differentiate segments primarily by age, gender, and travel budget. This finding extends prior segmentation research by suggesting that socio-demographic characteristics operate as primary layers for structurally differentiating tourism choices, particularly for urban-oriented and digitally intensive tourism categories (Forleo & Bredice, 2025; Moisa et al., 2025).
In contrast, preferences for nature and conservation tourism are less influenced by socio-demographic characteristics and are more strongly related to value-based factors. This indicates that sustainability concern operates as a distinct layer of influence that increases the likelihood of selecting nature-based tourism regardless of age or travel budget.
Cultural tourism shows a different pattern, where socio-demographic variables do not play a significant role once individual cultural orientation is considered. This result highlights that interest in local culture functions as a dominant predictor of cultural tourism choice, outweighing traditional demographic segmentation variables.
Conclusions
The findings demonstrate that tourism preferences are shaped by multiple layered interactions between structural and value-based factors, rather than by single-dimensional segmentation approaches. Socio-demographic characteristics remain an important differentiating factor, especially for urban and city and esports tourism. While older age groups show a stronger preference for nature and cultural tourism, gender, education, and travel budget factors are predictors that affect the category of tourist interest. Nature, culinary, and cultural tourism remain attractive across all segments. In addition, value-based factors such as sustainability and local culture interest, shape nature and culture-based tourism preferences, and support a multi-layered segmentation model.
McFadden’s relatively low pseudo-R² value suggests that there are other factors that are not observed, which may affect the choice of tourism category. In logistic regression, particularly in social science research, pseudo-R² values are based on likelihood, not on the variance described, so typically, values are generally lower than R² values in linear regression (Hu et al., 2006). Therefore, this model should be interpreted as a tool to identify the direction and strength of relationships between variables, and not as a predictive model.
This research has several limitations. First, the use of non-probability snowball sampling through social media networks may introduce sampling bias, with a tendency to overrepresent users who are younger, more digitally connected, and more active on social media. The findings should be interpreted with caution when generalizing. Future studies may adopt probability-based or stratified sampling techniques to obtain a more representative national sample.
Second, although the Chi-Square analysis in this study is exploratory, the large number of comparisons across tourism categories and predictor variables can potentially increase the risk of Type I errors (false positives). Therefore, these findings need to be interpreted with caution, and further research is recommended to be able to apply statistical corrections such as Bonferroni adjustments, in order to minimize this risk.
These findings offer several practical implications for tourism marketers, destination practitioners, and policymakers. Esports tourism can be promoted through gamer influencers, esports tournaments, and immersive digital campaigns targeting younger male audiences. Urban and city tourism can be marketed through social media content, by offering a lifestyle that emphasizes comfort, shopping, and entertainment for young tourists with higher vacation budgets. Nature tourism can be promoted through campaigns that focus on sustainability factors that highlight eco-friendly practices, conservation activities, and travel experiences that emphasize responsibility for environmental sustainability. Meanwhile, cultural tourism can be strengthened through storytelling-based communication strategies, which emphasize local traditions, heritage narratives, and authentic cultural experiences.
Acknowledgement
We gratefully acknowledge funding from the Directorate of Research, Technology, and Community Service (DRTPM), Directorate General of Higher Education, Research, and Technology, Ministry of Education, Culture, Research, and Technology of Indonesia. This funding was provided through the 2024 National Strategic Competitive Grant Scheme for Fundamental Research (Decree Number: 0459/E5/PG.02.00/2024, dated May 30, 2024; Contract Numbers: 105/E5/PG.02.00.PL/2024; 784/LL3/AL.04/2024; 092/VRRTT/VI/2024).
Data Availability
Supplementary materials have been archived on: https://doi.org/10.6084/m9.figshare.31821367
Declaration of Generative AI and AI-Assisted Technologies in the Writing Process
During the preparation of this article, the authors worked with the support of artificial intelligence to improve the English and avoid orthographic errors. After using this tool and service, the authors reviewed and edited the content. Reasonable efforts have been made to ensure accuracy, and the authors take full responsibility for the content of the publication.