
One of the primary functions of government is to provide public services. The New Public Service theory (Cui, 2009; Denhardt & Denhardt, 2000) makes it clear that the primary role of government is shifting from steering people’s actions through regulation and decree to serving its citizens. Government institutions are used to acting as the single provider of public services without competition. However, excellent service delivery to the citizens is still an obligation as compensation for the taxes paid by citizens. More importantly, several studies show that the quality of public service significantly affects citizen satisfaction with these services (Kaura, 2013; Li & Shang, 2020; Psomas, 2020), and citizen satisfaction with the quality of public services positively affects their trust in government (Citrin & Green, 1986; Mishler & Rose, 2001; Salim et al., 2017). The consequences of the trust in government are reflected in the public’s attitude. Trust encourages political participation and compliance with the law, paying taxes, and public policies (Levi & Stoker, 2000). Deteriorating confidence in government can lead to citizen revolutions and even civil wars (Salim et al., 2017).
To achieve high-quality public service, in line with the New Public Management and quality management principles discussed by Psomas (2020), it is necessary to periodically evaluate how government services are delivered. A commonly used evaluation method is through citizen satisfaction surveys. These are used in most OECD countries on a regular basis to identify areas that need further improvement (Benmansour, 2019; OECD, 2017). In Indonesia, a similar survey called the Assessment of Bureaucratic-Reform Results (SHPRB) is conducted annually by the Ministry of Administrative and Bureaucratic Reform (KemenPANRB). Citizen satisfaction surveys aim to measure citizens’ satisfaction level with service quality (Benmansour, 2019; ur Rahim & Shirazi, 2018). Citizen satisfaction surveys result in an interval scale from totally dissatisfied to completely satisfied (Akinboade et al., 2012; Benmansour, 2019), a satisfaction rating (Chodzaza & Gombachika, 2013), or a satisfaction index (ur Rahim & Shirazi, 2018).
Survey shortcomings are usually associated with the data collection method. Based on our review of the literature, many customer satisfaction surveys, citizens’ opinions are collected using face-to-face interviews or focus groups, as was done by researchers in Qatar (Benmansour, 2019), Pakistan (ur Rahim & Shirazi, 2018), Yemen (Salim et al., 2017), Ghana (Anaman et al., 2017), Malawi (Chodzaza & Gombachika, 2013), and South Africa (Akinboade et al., 2012). These traditional methods usually are quite costly and time-consuming (Qi et al., 2020). Sample size is the most important element that influences the cost (Barbu & Isaic-Maniu, 2011). Therefore, the number of respondents is limited to a certain number and is reduced by the number of non-responses. As the number of respondents is limited, the number of opinions collected on the satisfaction survey are also limited. Another drawback is the flexibility and the variety of information covered which is also limited by the items available on the questionnaire.
Many researchers suggest using social media data as a supplement or even a replacement for conventional surveys (Kwak & Cho, 2018). Aligned with the global development of data collection methods, which tends to move in the direction of faster and less costly, data collection from social media is affordable and timely (Barbu & Isaic-Maniu, 2011; Kwak & Cho, 2018). With the rapid growth of social media, people tend to use social media to express their feelings, including their opinion towards the services offered by government agencies (McGregor, 2019; Murphy et al., 2014). Clearly, public opinion is available on social media in huge numbers, making it possible to be collected in large amounts and varieties. With a million stable, active users, Twitter is frequently used to gauge public opinion with regard to specific topics rather than other social media platforms (Qi et al., 2020).
This study focuses on exploring the potential of Twitter as a measuring tool to evaluate the quality of public services. Research conducted by Martin-Domingo et al. (2019) shows that using sentiment analysis techniques, a Twitter dataset can be used to evaluate airport service quality. Several studies have tried to utilize tweets to evaluate public satisfaction towards government agencies (Aziz et al., 2018; Lailiyah et al., 2017; Pratama & Purwarianti, 2017; Seki, 2016; Susilawati, 2016). However, the research mostly focused on the prediction of sentiment polarity or mostly discussed topics related to certain services. To our knowledge, none of this research identifies how social media can be used beyond the traditional public service evaluation methods. This research takes a step further by examining if the evaluation of public service based on social media data and machine learning is appropriate and feasible. This research may act as a basis for further research related to social media utilization in government evaluation and policymaking. Most studies about government social media predominantly set their focus on the management of social media, including social media strategy and improvement of citizen engagement (Medaglia & Zheng, 2016). Research that shows concrete examples of how citizen opinion from social media can be used in government evaluation and policymaking is rather limited. As a pilot test, we conducted the evaluation of public services delivered by the provincial government of Jakarta.
Theoretical Background
Measurement Aspects of Public Service Quality
There are several aspects or dimensions that are measured in service quality evaluations. The service quality measurement model most referred to, SERVQUAL, defines 5 service quality aspects or dimensions to be measured: assurance, empathy, reliability, responsiveness, and tangibles. However, according to Bai and Ye (2005), public service characteristics are different from common services, and it is necessary to use a special quality measurement system to evaluate public services. Generally, government institutions will develop their own guidelines or regulations on public service evaluation.
In Indonesia, regulations related to the evaluation of public service performance (SHPRB) are outlined in KemenPANRB Regulation No.1 of 2015, No.14 of 2014, and No.16 of 2014. According to those regulations, aspects or dimensions that are measured in service quality evaluations consist of:
-
Service procedures/flow. This aspect relates to the ease of procedures in every stage of service delivery.
-
Service requirements. This refers to accessibility, comprehensibility, and consistency of information about all things that must be prepared to receive the service.
-
Service costs. This aspect refers to conformity of the amount and procedures related to the payment of fees with the information provided to citizens.
-
Service time. This refers to compliance with the opening hours, closing hours, and the time required to complete the entire service.
-
Service officers. This aspect assesses the ease of recognition, friendliness, politeness, and quickness of officers in responding to users’ needs. Officers must not be discriminatory and may not ask for money outside the service costs.
-
Service software/apps. This criterion assesses the reliability, ease of use, and responsiveness of software applications used for service delivery.
-
Facilities and supporting infrastructure for services. This is measured by the availability of special buildings or spaces for the services, waiting rooms, and parking lots, special toilets for service users, facilities for disabled users, lactation rooms, and complaint facilities.
In this study, people’s opinions from social media were categorized into these seven aspects. Categorizing people’s opinion about public service into seven categories is a text classification problem. Text or topic classification is the task of classifying texts or documents into different predefined topics or labels (Bencke et al., 2020; Liu, 2012). Since text or topic classification is a classification problem, any existing supervised learning method is applicable (Liu, 2012). Previous research used different approaches to build the classifier model. Some researchers claimed that the Decision Tree Classifier has one of the best performances (Bencke et al., 2020; Chamby-Diaz & Bazzan, 2019). Altammami and Rana (2017) found that one of the most accurate algorithms is the support vector machine (SVM). The Naïve Bayes algorithm, which achieved surprisingly high accuracy on classification tasks (Zhang et al., 2018), was also used in Zhu (2018) and Burnap et al. (2017). Based on the previous research, this research used the Decision Tree, the SVM, and the Naïve Bayes algorithms to build the aspect classifier. The classified tweets were then used to predict the public services quality score.
Text-based Score Prediction
In general, the final result of public service evaluation is a satisfaction score or rating (Chodzaza & Gombachika, 2013), or a satisfaction index (ur Rahim & Shirazi, 2018). The score shows the level of quality of public services such as totally dissatisfied, poor, good, excellent, or completely satisfied (Akinboade et al., 2012; Benmansour, 2019). In Indonesia, according to KemenPANRB Regulation No.17 of 2017, the assessment of public service quality results in a score. The score was classified into 8 categories shown in Table 1. Each category represents the performance of public service providers from Very Poor to Excellent.
To generate a similar score from collected tweets, or what we called a public service quality score, we found some literature that predicts a score by utilizing text in online user reviews such as research by Ganu et al. (2009) and Ganu et al. (2013) which translated restaurant reviews into ratings. To predict rating scores, the sentiment polarity of the text reviews was first classified. The sentiment polarity is then calculated using Equation 1, where P is the number of text reviews in positive class, and N is the number of text reviews in negative class.
TextRating=[PP+N×4+1]
Equation 1 was adopted in several studies to predict rating scores from restaurant reviews (Gojali & Khodra, 2016) or from Google Play reviews (Monett & Stolte, 2016). Research by Monett and Stolte (2016) compared Equation 1 with other methods and calculated score ratings from mobile app reviews in Germany. The results show that Equation 1 provides the best prediction of rating scores compared to other methods. Based on that finding, this study also uses Equation 1 to measure public service satisfaction based on tweets, in a form of public service quality (PSQ) score. As the formula needs sentiment polarity, we also built a classifier to obtain the sentiment polarity of each tweet.
Sentiment analysis is applied to distinguish opinion orientation (positive and negative), such as from comments on Twitter (Sokolowska et al., 2019) or in a Facebook group (Kaur et al., 2019). Some studies used unsupervised learning methods by utilizing lexicon-based sentiment analysis tools such as the MeaningCloud (Singh et al., 2018), Theysay (Martin-Domingo et al., 2019), VADER (Georgiadou et al., 2020), and SentiWordNet (Aziz et al., 2018; Lailiyah et al., 2017). Lexicon-based sentiment analysis is a robust and an excellent cross-domain performance method for sentiment analysis (Madan et al., 2018). Nonetheless, Indonesian lexical resources for sentiment are very limited (Koto & Rahmaningtyas, 2017). Since sentiment analysis is a text classification task, many researchers used supervised learning methods like Naïve Bayes (Corallo et al., 2015; Susilawati, 2016), SVM (Aziz et al., 2018; Corallo et al., 2015), and Random Forest (Rekha et al., 2019). Therefore, we built the sentiment classifier using a supervised approach, based on studies, that used Naïve Bayes, SVM, and Random Forest.
Pilot Test Approach
We conducted the evaluation of public services delivered by the provincial government of Jakarta, Indonesia. We chose provincial government of Jakarta as a pilot test because, according to a survey in 2018 by the Indonesian Internet Service Providers Association (APJII), the highest Internet user penetration in Indonesia is in Jakarta. The social media data were collected only from Twitter. The first reason is because in Indonesia almost all government institutions have their own official Twitter account in line with the Minister of Communication and Information encouragement to increase public communication via social media. Second, the number of Twitter users in Indonesia is the fifth largest in the world, and the tweet posting activity is the third greatest in the world (Aziz et al., 2018). The flow to evaluate public service quality through social media is shown in Figure 1. It is following the general framework of text analysis (Hu & Liu, 2012), with an addition to the last stage, namely translating tweets into PSQ scores.
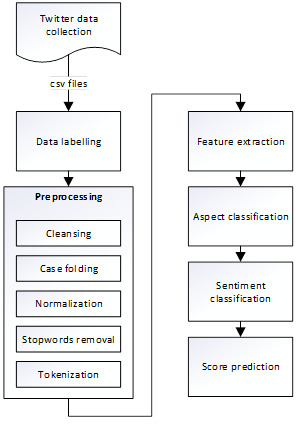
The initial stages consisted of data collection. Under the authority of the provincial government of Jakarta, there are many units of public service. In this study, we chose to evaluate three public service units, namely Department of Population and Civil Registration (Dukcapil), the One-stop Administration Services Office (SAMSAT), and One-Stop Integrated Services and Investment (DPMPTSP). There is no certain keyword to get the tweets; therefore, the crawling process applied to all tweets that mentioned the official account of those three public service agencies. We limited the data collection to tweets posted from January 2019 to July 2020.
The collected data needed to be prepared to be ready to use for machine learning. So, the next stage after data collection was data labeling and preprocessing. We started with removing tweets from non-users of public services, such as tweets from news accounts and self-tweets from the official account of the public service agency. Tweets unrelated to measurement aspects of public service quality were also removed. All text was transformed to lowercase letters and followed by the removal of hyperlinks, mentioned usernames, hashtags, symbols, and numbers that did not represent time. All slang words in remaining tweets were replaced with proper Indonesian spelling based on an Indonesian colloquial dictionary (Aliyah Salsabila et al., 2019). All stop words were also removed using Tala’s (2003) dictionary. The preprocessing ended with removing duplicate tweets. Duplicate tweets were identified by similar username or similar tweet texts.
After the preprocessing stage, all clean tweets were divided into training and testing dataset. Tweets collected from 2019 were prepared as the training dataset while tweets collected from 2020 were prepared as testing dataset. We applied several machine learning methods to the training dataset, as discussed in the previous section, to build the aspect classifiers and sentiment classifiers. Each algorithm was combined with three different forms of Bag of Words (BOW) used to represent the value of each feature, namely term frequency–inverse document frequency (TF-IDF), term frequency, and binary term occurrences. The dataset was propagated using Synthetic Minority Over-sampling Technique (SMOTE). SMOTE is an oversampling technique that multiplies minority class to decrease over-fitting and bias from supervised data mining process (Aggarwal, 2016). Each of the training datasets was individually processed into a cross-validation with 10 k-fold. Cross-validation with 10 k-fold is recommended for accurate estimation and it has relatively low bias (Han et al., 2012).We then compared the performance of all classifiers built from the three algorithms. The performance was analyzed and evaluated based on accuracy, precision, recall, and F1 score. The classifier with the best performance was selected and used to predict the aspect and the sentiment of the 2020 tweets. To evaluate the result of the prediction, we compared the aspect and sentiment of each tweet with the manual labels by annotators.
Based on the predicted aspect and sentiment, at the last stage we calculated the public service quality (PSQ) score. As discussed in previous section, Equation 1 provides the best prediction to generate a score from text or tweets. In the same way as the formula was used in Ganu et al. (2009, 2013), Gojali and Khodra (2016), and Monett and Stolte (2016), the PSQ score was calculated as follows:
PSQ Score=1nn∑i=1PSQ Scorei
is the sub-score for each service unit, with is the number of service units (in our case,
PSQ Scorei=1mm∑j=1[PijPij+Nij×4+1]
where:
are measurement aspects of public service quality (in our case,
is the number of tweets in positive class in aspect service unit
is the number of tweets in negative class in aspect service unit
The following is the algorithm for calculating the PSQ Score of Jakarta Provincial Government using Equations 2 and 3.
 1.	i=Dukcapil,SAMSAT,DPMPTSP
 2.	For each service unit i
 3.	j=procedure, requirements, costs, time, service officers, software/apps, facilities
 4.	For each aspect j of service unit
 5.	Count the number of tweets in positive class (Pij)
 6.	Count the number of tweets in negative class (Nij)
 7.	Calculate the PSQ Score of aspect j (Pij/(Pij+Nij)*4+1)
 8.	End For

 9.	Calculate PSQ score of service unit i = the average PSQ score of all aspect j of service unit i
 10.	End For

 11.	Calculate PSQ Score of Jakarta Provincial Government = the average PSQ score of service unit i
The PSQ score range is 1 to 5. The score was then converted into the public service quality category shown in Table 1, referring to Public Service Quality Categories from Indonesia Government.
Result and Discussion
Based on the pilot test, we found that the evaluation of public services using social media has both possibilities and limitations. The strengths and weaknesses are analyzed from several perspectives. The first point of view is from the size and representativeness of collected tweets. Second, the relevance of collected tweets to measurement aspects of public service quality. Finally, we describe the pros and cons of the result of satisfaction score prediction.
Collected Tweets: Size Versus Representativeness
We successfully collected 3,718 tweets from 2019 and 9,564 tweets from 2020. The examples of the collected tweets related to public service of the Jakarta provincial government are shown in Table 2.
The total number of cleaned tweets after the preprocessing stage was 1,897 tweets, 728 tweets from 2019 and 1169 tweets from 2020. This shows the potential for evaluating public services using social media in terms of sample size. This number is very large when compared to the number of respondents in SHPRB, which was only 30 people per public service unit, or when compared to other customer satisfaction surveys such as (Chodzaza & Gombachika, 2013) who were only able to collect 92 respondents due to non-response issues. During the preprocessing, tweets that are collected have been confirmed to come from a unique user account so that each tweet can represent one respondent. As discussed in Kwak and Cho (2018), we confirm that the use of social media has an advantage in terms of a larger number of respondents. This number is expected to continue to increase, in line with the increasing use of social media (Martin-Domingo et al., 2019) and increasing participation in online public services (United Nations Department of Economic and Social Affairs, 2018, 2020).
Based on the collected tweets, tweets-related to Jakarta provincial government public services significantly increased in 2020. Based on our analysis, the increase in the number of tweets was related to the large-scale social restrictions policy (PSBB) enforced by the governor of Jakarta to control the impact of the COVID-19 pandemic. The increase began in April 2020 and continued until June 2020, the same time as PSBB enforcement in Jakarta. Due to PSBB, the local government in Jakarta was limiting the activities of its agencies and delivering most of their services online. This phenomenon is interesting and shows that, since the public cannot directly see the officials in charge of public services, the communication between the public and the agencies happens through the long-distance communication media, one of which is the government social media account.
From the data collection stage, we collected not only the text of the tweets, but also other attributes such as date, time, and username. Unfortunately, other attributes such as age, gender, and user location could not be collected because these data are protected by Twitter and cannot be accessed by the public (Twitter, 2021). Consequently, although tweets can be collected in a very large number, we cannot guarantee that they are representing the demographics and locations of public service users. Thus, the results of the evaluation of public services obtained through social media are likely to be biased. Indeed, many researchers from various fields consistently point out this representativeness issue (Kwak & Cho, 2018). Some researchers also stated that public opinion obtained from social media only represents Internet users, not the entire population (Steinmetz et al., 2014; Valliant & Dever, 2011). However, some other researchers stated that this issue will lose relevance as Internet penetration increases (Kroh et al., 2016). Also, with a great number of respondents, the representativeness may be overstated (Heiervang & Goodman, 2011). In addition, the demographics of users, such as age and gender, can be estimated using machine learning (Chang et al., 2010; Karimi et al., 2016; Mislove et al., 2011), and thereafter the users can be sampled using certain sampling methods such as random sampling (Barberá & Rivero, 2015) or quota sampling (Barberá & Rivero, 2015; Davis, 2017).
Relevance of Tweets to the Aspects of Public Service
In most public service quality measurements, there are defined aspects to be measured. The advantage of social media usage is that tweets can be grouped into those defined aspects. Categorization can be done either manually by humans or automatically using machine learning. Based on this classification, we can conduct the analysis and get the results of the evaluation of public services like the results of the conventional survey.
However, there are some pros and cons when it comes to categorizing these tweets’ aspects. First, the number of tweets for each aspect cannot be controlled. The number of tweets between aspects is not balanced. As shown in Table 3, the 2019 tweets were most frequently categorized as time-related, while the 2020 tweets were most frequently categorized as software/apps-related. It can be interpreted that higher proportion represents the level of importance of public service aspects from the users’ point of view. However, when the number of tweets in an aspect is very small, the aspect becomes difficult to analyze. It can be seen in Table 3 that the aspect with almost no tweets is cost. There are only 20 tweets related to the cost aspect, 8 tweets in 2019 and 11 tweets in 2020.
As a second limitation, there are many tweets that do not fit into any category and must be removed: 2,990 tweets in 2019 or 80.42% were eliminated at the preprocessing stage, while 8,395 tweets (87.78%) from 2020 were eliminated. The eliminated tweets mostly contain questions. The third limitation is related to the accuracy of the aspect classifier using machine learning. Accuracy shows the percentage of tweets that are classified correctly against the total number of tweets (Han et al., 2012). The aspect classifier was built using the Naïve Bayes algorithm, which was found to have the best performance, as well as the sentiment classifier. The accuracy of the aspect classifier is shown in Table 4, side by side with the performance of classifier for sentiment prediction. Table 4 shows that the aspect prediction accuracy tends to be low. It is much lower than the sentiment prediction accuracy. Low accuracy risks many tweets being categorized into the wrong aspect. Although there are no certain criteria for a successful prediction model (Kwak & Cho, 2018), our proposed method on aspect classification needs to be further examined before replication.
Besides all these shortcomings, the advantage of using social media is that we can capture broader public opinion. We can capture and understand public aspirations outside the defined and limited aspects of public service. From the most frequent words appearing in tweets, service providers can determine which services are in the spotlight of society and which part of the quality improvement program should be prioritized. For example, we found that one of the words most frequently appearing in 2020 tweets is “SIKM”, i.e., a reference to a permit from the provincial government of Jakarta to enter and exit Jakarta during the PSBB period, which appears 185 times. Meanwhile, appearing 163 times, the most frequent phrase in 2019 is “kartu tanda penduduk” or resident identity card. These are the most discussed topics by Twitter users, which quality improvement can be focused on.
The Result of Satisfaction Score Prediction
From the predicted aspects and sentiments, we calculated the satisfaction or public service quality (PSQ) score of the 2020 Jakarta provincial government. The result is shown in Table 5.
PSQ score per aspect ranges from 1.00 to 3.22. In most aspects, the quality of public services of the three samples are Poor/Very Poor (score 1.01-2.00). The PSQ scores for Dukcapil, SAMSAT, DPMPTSP are 2.38, 1.57, and 1.16, respectively. Averaged from those three PSQ score, the final PSQ score of the Jakarta provincial government in 2020 is 1.70. The value falls into category D, which is Poor. Unfortunately, the scores we predicted from these tweets cannot be compared with the detailed results of the SHPRB, because they are not available to the public. However, the results of the score prediction indicate that from online reviews on social media, a score or rating indicating the level of quality of public services can be obtained.
We checked the potential for bots’ intervention on the score obtained. We used Botometer, a machine-learning based application to check the activity of a Twitter account and give it a score where low scores indicate likely human accounts and high scores indicate likely bot accounts (Sayyadiharikandeh et al., 2020). Of the total accounts whose tweets were analyzed to obtain this PSQ score, 89% are human-like accounts. While 2% of them are indicated bot-like accounts. The other 9% accounts’ classification is uncertain because the score is in the middle of the scale. This result shows that the proportion of bot-like accounts is low. It also indicates that the potential for bots’ intervention on the PSQ score obtained from social media is low. This finding is aligned with the data shown in the report of Bradshaw and Howard (2019) which claimed that Indonesia is not a country where government agencies manipulate opinions on social media using bots or individual actors. Still, based on this report, bots and individual actors in Indonesia tend to manipulate opinions related to politics, especially the opposition (Bradshaw & Howard, 2019).
Another finding from this research is that tweets related to public services by the Jakarta provincial government were dominated by tweets with negative sentiment; 81% of all tweets are tweets with negative sentiment. The detailed proportion of negative tweets per aspect can be seen in Table 3. Except for the aspect of service officers, on the other six aspects, the proportion of tweets with negative sentiment is much higher than the number of positive tweets. It affects the final PSQ score of the Jakarta provincial government, putting it into the Poor category. Most PSQ scores per aspect also fall into the Poor or Very Poor category.
Apart from being more numerous, the content of negative tweets tends to be more detailed than the positive ones. In negative tweets, users tell in detail every complaint or problem experienced. On the other hand, in positive tweets, users only say thank you without explaining what they are thanking for. Atypical example of positive tweet is:
“@dukcapiljakarta terima kasih banyak atas segala bantuannya”
Translation:
“@dukcapiljakarta thank you very much for all your help”
A typical example of negative tweet is:
“mestinya aplikasi mengupdate menginformasikan kartu tanda penduduk tercetak min fleksibel kasihan masyarakat bolak kelurahan kartu tanda penduduknya”
Translation:
“There should be an app to inform the public of the progress of identity cards. People should not go back and forth to the sub-district office just to get the information”
This dominance of negative tweets is commonplace. It has been found that online complaints are a common practice (Hutchinson, 2020). Other survey results (Sprout Social, 2017) show that if customers saw inappropriate behavior or performance, 47% of them would call out the company on social media, while only 8% would remain silent. It is feared that the dominance of these negative tweets will cause bias in the PSQ score.
Conclusion and Future Research
This research shows that Twitter, as one social media platform, has potential to be used for the evaluation of public services. First, the use of social media has an advantage in terms of sample size. This size is predicted to increase along with the increase in social media users and public participation in online services. Then, in a public service evaluation, government institutions commonly develop guidelines or regulations defining aspects or dimensions to be measured. By using Twitter, we can collect tweets and classify them according to those aspects manually by humans or automatically using machine learning. More than that, the collected tweets vary greatly and are not limited to the aspects, showing that Twitter serves as a remarkable tool to understand public opinion. Last, using sentiment analysis technique, we can calculate a satisfaction score or rating like in a customer satisfaction survey. In this study, the score is named as the Public Service Quality (PSQ) Score. Having checked using an application called Botometer, we have confirmed that the score is not influenced by bots or individual actors.
Even so, we know that Twitter analysis cannot be a perfect solution. We cannot be assured that the collected tweets represent all public service users demographically or geographically.; Some researchers have stated that representativeness of the respondents may be overstated with a large number of respondents. It is quite possible that many people who are satisfied with government services never bother to express their opinion through social media. There is a predominance of tweets with negative sentiments from the collected tweets, and it is feared this will affect the satisfaction score. Further work is needed to overcome these limitations.
For further utilization of government social media, our paper shows how the government can leverage citizen opinion from their official account to evaluate the quality of public service that they provide. The result score could be used to complement the results of conventional public opinion surveys. The method suggests that the government can listen to broad public opinion, detect complaints, and identify areas of good and poor aspects of service quality. The Indonesian case is not easily generalized. Our proposed method should be examined in other cases to extend the analysis to a much larger sample. We also realize that there are many countries where Twitter is not popular. While this study only pays attention to Twitter, further study is needed to examine whether our proposed method can be applied to other social media platforms.
This research also shows a step further of textual analysis by combining both sentiment analysis and topic classification to translate tweets into a score, especially in the public sector domain. However, we have shown that the model built to classify users’ posts into several classes of public service aspects is not perfect. The models for aspect classification built in this study have low accuracy and therefore need to be studied more deeply in future research.